

Question: Write a main function that uses matplotlib to display a line graph of average monthly high temperature for particular city in a particular year.
 \
\
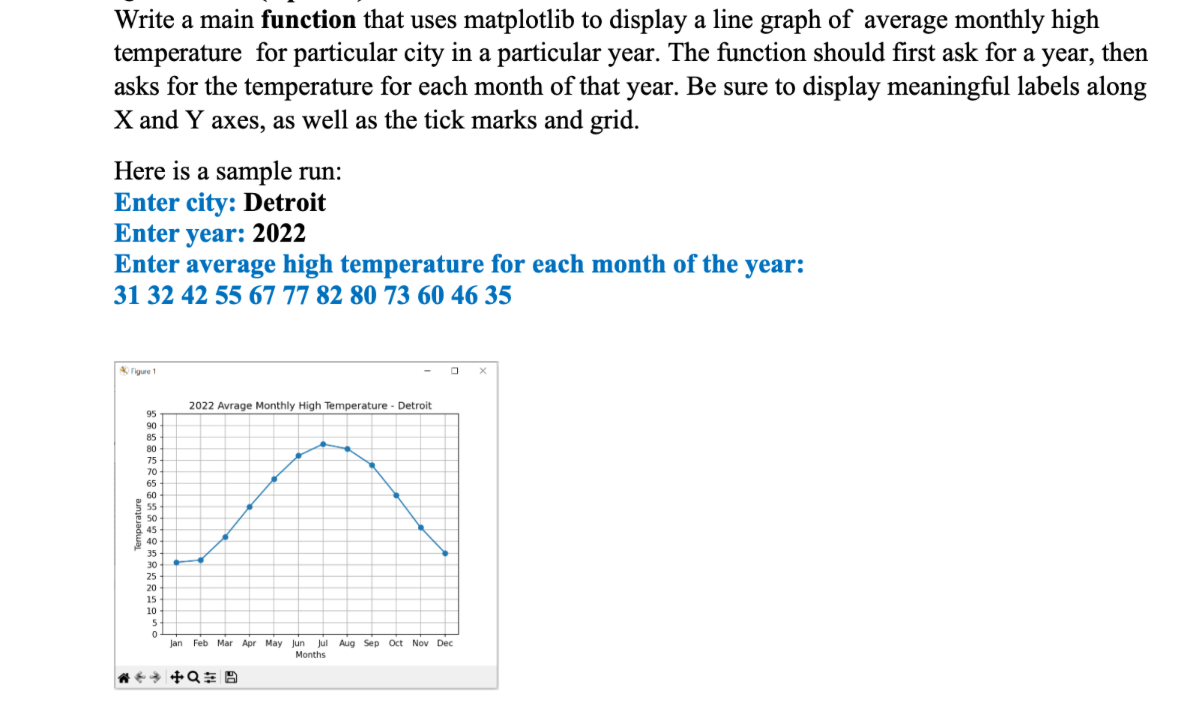
Write a main function that uses matplotlib to display a line graph of average monthly high temperature for particular city in a particular year. The function should first ask for a year, then asks for the temperature for each month of that year. Be sure to display meaningful labels along X and Y axes, as well as the tick marks and grid. Here is a sample run: Enter city: Detroit Enter year: 2022 Enter average high temperature for each month of the year: 31 32 42 55 67 77 82 80 73 60 46 35 Figure 1 95 90 85 80 75 70 65 60 55 50 45 40 35 30 25 20 15 10 5 0 2022 Avrage Monthly High Temperature - Detroit 0 Jan Feb Mar Apr May Jun Jul Aug Sep Oct Nov Dec Months ++Q=9
Step by Step Solution
There are 3 Steps involved in it
To display a line graph of average monthly high temperatures for a particular city in a specific yea... View full answer

Get step-by-step solutions from verified subject matter experts