

Question: Write a Matlab APP program as shown below. Implement the button click callback to allow a user to select a population data file using uigetfile
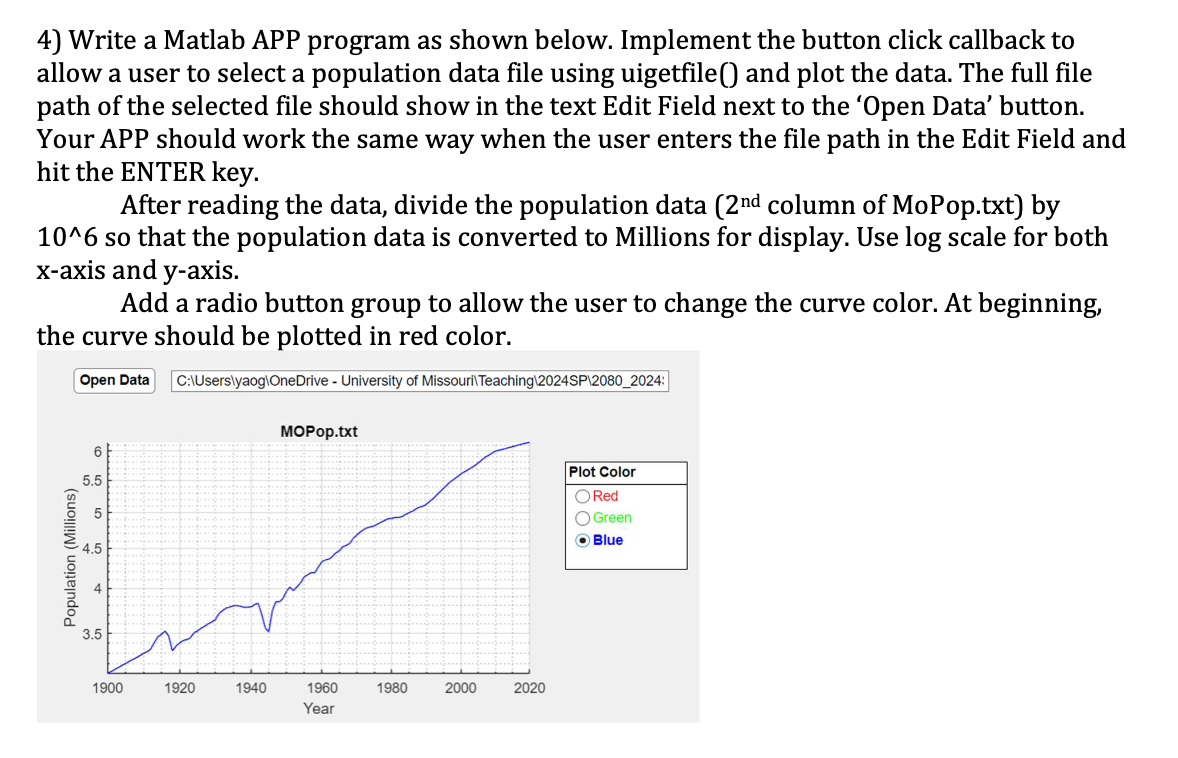
Write a Matlab APP program as shown below. Implement the button click callback to
allow a user to select a population data file using uigetfile and plot the data. The full file
path of the selected file should show in the text Edit Field next to the 'Open Data' button.
Your APP should work the same way when the user enters the file path in the Edit Field and
hit the ENTER key.
After reading the data, divide the population data column of MoPop.txt by
so that the population data is converted to Millions for display. Use log scale for both
axis and axis.
Add a radio button group to allow the user to change the curve color. At beginning,
the curve should be plotted in red color.
C:IUserslyaoglOneDrive University of MissourilTeachinglSP:
Step by Step Solution
There are 3 Steps involved in it
1 Expert Approved Answer
Step: 1 Unlock

Question Has Been Solved by an Expert!
Get step-by-step solutions from verified subject matter experts
Step: 2 Unlock
Step: 3 Unlock