

Question: Write a MATLAB code using the Live Script editor that will calculate the slope and the y intercept of the best fitting straight line for
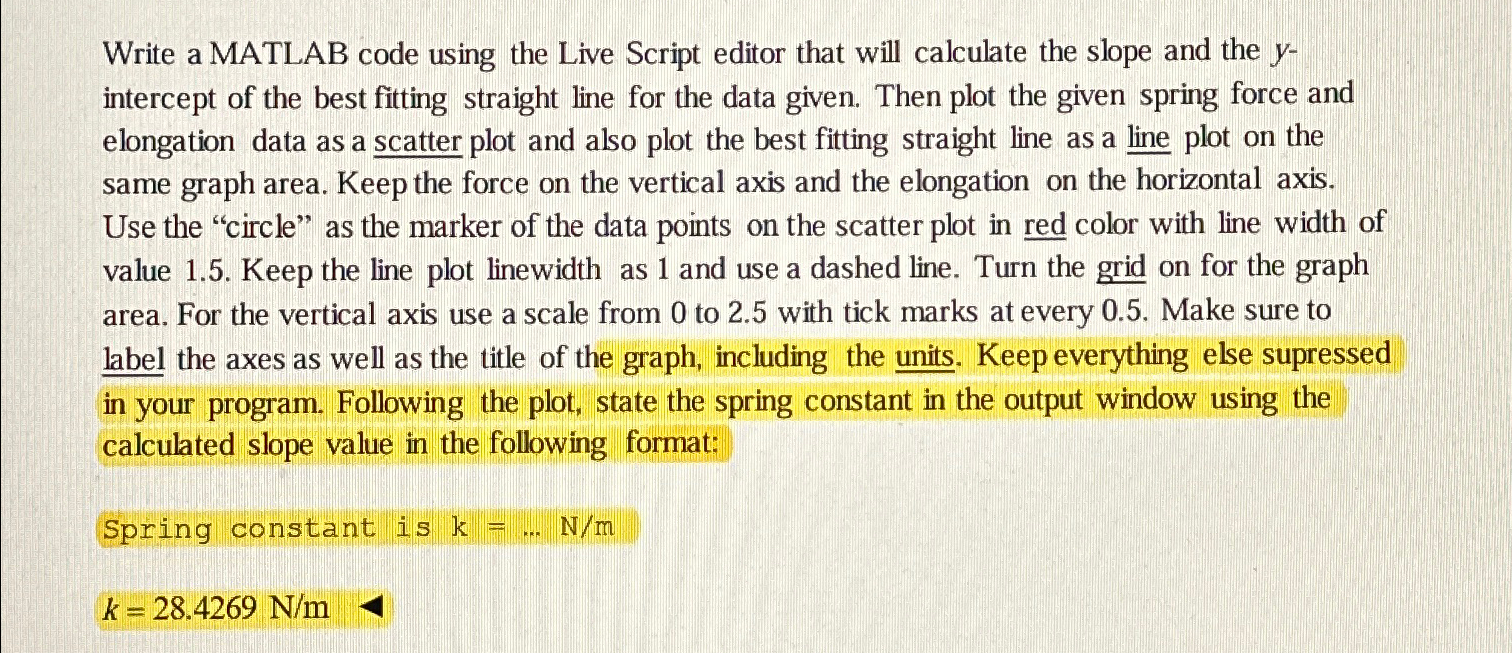
Write a MATLAB code using the Live Script editor that will calculate the slope and the intercept of the best fitting straight line for the data given. Then plot the given spring force and elongation data as a scatter plot and also plot the best fitting straight line as a line plot on the same graph area. Keep the force on the vertical axis and the elongation on the horizontal axis. Use the "circle" as the marker of the data points on the scatter plot in red color with line width of value Keep the line plot linewidth as and use a dashed line. Turn the grid on for the graph area. For the vertical axis use a scale from to with tick marks at every Make sure to label the axes as well as the title of the graph, including the units. Keep everything else supressed in your program. Following the plot, state the spring constant in the output window using the calculated slope value in the following format:
Spring constant is dots
Step by Step Solution
There are 3 Steps involved in it
1 Expert Approved Answer
Step: 1 Unlock

Question Has Been Solved by an Expert!
Get step-by-step solutions from verified subject matter experts
Step: 2 Unlock
Step: 3 Unlock