

Question: Write a MATLAB function named expsinplot(tau, omega) that accepts scalars tau (value of T) and omega (value of w) and plots the function y(t) =
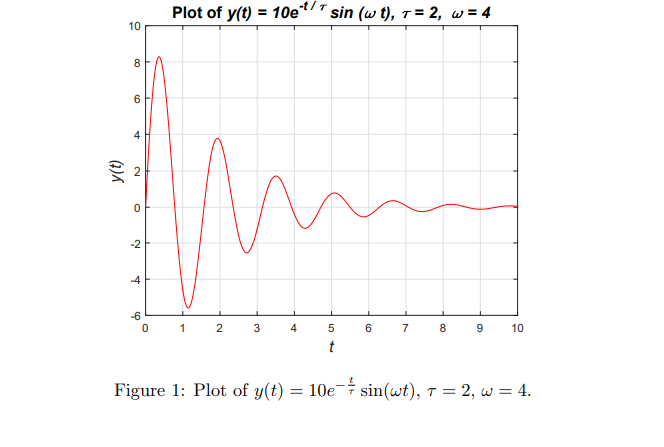
Write a MATLAB function named expsinplot(tau, omega) that accepts scalars tau (value of T) and omega (value of w) and plots the function y(t) = 10e sin(wt). The various tasks in this exercise include: a) First, construct a vector for 1001 values of t between 0 and 10 using linspace. Then, compute y values for function y(t) = 10e = sin(wt) in the vector t using vectorized calculation (e.g., .*, see Lecture 8). Plot the function given by (t,y) using plot (use solid red lines and displays the grid lines). b) Use the title command to print out the mathematical formula (An expression is interpreted as latex in MATLAB, with a ^ indicating a superscript. Thus e^2 is ea. See Lecture 9). Also print the values of tau and omega in the title. Read this document to see how convert numeric values to text. You can use any method that you desire. Also use xlabel and ylabel to label the r and y axes in your figure. Set the font size to a larger value (e.g., 14) using FontSize. c) Write a MATLAB function named expsinplots (taus, omegas) that calls expsinplot(tau, omega). The inputs taus and omegas are two M-dimensional vectors: taus = [taul, ..., tauM], omegas = [omegal, ..., omegaM] (M can be an arbitrary positive integer, should not be pre-specified. You may use size or length to obtain the value of M). expsinplots calls expsinplot M times (using a for loop), and at time i, expsinplot accepts taui and omegai (i =1...,M) as its inputs and plot the figure. Thus, expsinplots will plot M figures. d) Write a MATLAB function named expsinsubplot(taus, omegas) that calls expsinplot(tau, omega). Instead of plotting M individual figures, expsinsubplot will create a single figure with M (M-by-1) subplots. Test expsinplot by choosing tau = -3, omega = 5 and tau = 1, omega = 10. Test expsinplots and expsinsubplot by choosing taus = [-5, -2, 10], omegas = [20, 10, 5]. = 2, omega = 4) Hint: The call expsinplot from the command line (tau 1 expsinplot (2,4) should produce a figure similar to Figure 1. Plot of y(t) = 10e**/* sin (w t), 1 = 2, w = 4 10 8 6 4 y(t) m 0 -2 -4 -6 1 2 3 4 7 8 9 10 5 6 t Figure 1: Plot of y(t) = 10e = sin(wt), T = 2, w = 4
Step by Step Solution
There are 3 Steps involved in it

Get step-by-step solutions from verified subject matter experts