

Question: Write a MATLAB program that will read in and plot data from a text file of the data (below) Specifically, it should generate a figure
Write a MATLAB program that will read in and plot data from a text file of the data (below) Specifically, it should generate a figure with two subplots, one that plots both high and low temperatures versus time, and one that plots the precipitation versus time. Be sure to label your figure well and use good practices.
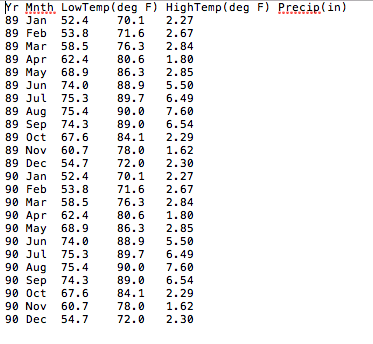
Mr Mnth. LowTemp(deg F) HighTemp(deg F) Precip(in) 89 Jan 52.4 70.1 2.27 89 Feb 53.8 71.6 2.67 89 Mar 58.5 76.3 2.84 89 Apr 62.4 80.6 1.80 89 May 68.9 86.3 2.85 89 Jun 74.0 88.9 5.50 89 Jul 75.3 89.7 6.49 89 Aug 89 Sep 890ct 89 Nov 89 Dec 90 Jan 90 Feb Mar Apr 90 May 68.9 86.3 2.85 Jun Jul Aug Sep Nov Dec h774 50904920774050904920 2 6 8 8 8 5 4 6 5 2 6 3 2 6 8 885465263 H222-256762-2222-25676212 163639700100-63639700_00 e0-6068909482016068909482 d77788898877777888898877 T 4 8 5 490343677485490343677 0238284554704238284554704 L555667 77665555667777665 t: n b r r y n-gpt > c n b r r y n-gpt > c n: a e a pauuuecoeaeapauuuecoe M:J F M A M J J A S 0 N D J F M A M J J A S 0 N D r99999999999900) 0 0 0 0 0 0 0 0 0 0 Mr Mnth. LowTemp(deg F) HighTemp(deg F) Precip(in) 89 Jan 52.4 70.1 2.27 89 Feb 53.8 71.6 2.67 89 Mar 58.5 76.3 2.84 89 Apr 62.4 80.6 1.80 89 May 68.9 86.3 2.85 89 Jun 74.0 88.9 5.50 89 Jul 75.3 89.7 6.49 89 Aug 89 Sep 890ct 89 Nov 89 Dec 90 Jan 90 Feb Mar Apr 90 May 68.9 86.3 2.85 Jun Jul Aug Sep Nov Dec h774 50904920774050904920 2 6 8 8 8 5 4 6 5 2 6 3 2 6 8 885465263 H222-256762-2222-25676212 163639700100-63639700_00 e0-6068909482016068909482 d77788898877777888898877 T 4 8 5 490343677485490343677 0238284554704238284554704 L555667 77665555667777665 t: n b r r y n-gpt > c n b r r y n-gpt > c n: a e a pauuuecoeaeapauuuecoe M:J F M A M J J A S 0 N D J F M A M J J A S 0 N D r99999999999900) 0 0 0 0 0 0 0 0 0 0
Step by Step Solution
There are 3 Steps involved in it

Get step-by-step solutions from verified subject matter experts