

Question: Write a MATLAB script that draws the travel time graph for (1) the direct wave, (2) the head wave from the boundary between the 1st
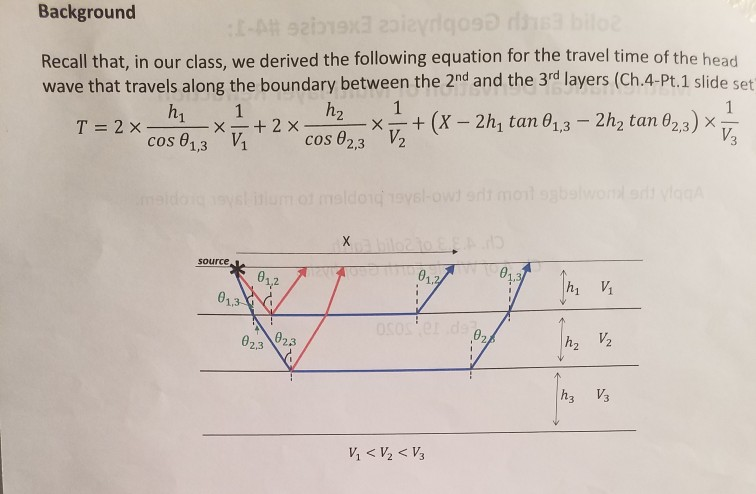
Write a MATLAB script that draws the travel time graph for (1) the direct wave, (2) the head wave from the boundary between the 1st and the 2nd layers, and the head wave from (3) the boundary between the 2nd and the 3rd layers. Assume that all the layers are horizontal. The three travel time curves/lines should be drawn in one graph with the horizontal axis being the source-receiver distance (km) and the vertical axis being the travel time (seconds) increasing upward. The axes must be properly labeled. Use different colors for the three curves/lines, black for (1), blue for (2), and red for (3). Use the following values for the parameters. X = 0 to 50 km. V2 = 2 km/s, V2 = 3 km/s, V3 = 4 km/s h = 3 km, hz = 4 km, h3 = 3 km Dit at your MATLAB script and the graph stol . Background Recall that, in our class, we derived the following equation for the travel time of the head wave that travels along the boundary between the 2nd and the 3rd layers (Ch.4-Pt.1 slide set ha 1.2x h2 x 1 T = 2 x x = + (x 2h, tan 01,3 - 2h2 tan 023 cos 61,3 V1 -2x cos 02, SloVSE ource * 022 023 023 023 Vi
Step by Step Solution
There are 3 Steps involved in it
1 Expert Approved Answer
Step: 1 Unlock

Question Has Been Solved by an Expert!
Get step-by-step solutions from verified subject matter experts
Step: 2 Unlock
Step: 3 Unlock