

Question: Write a MATLAB script that plots the following functions f(t) and gt) in the same plot area in the same figure window, for the values
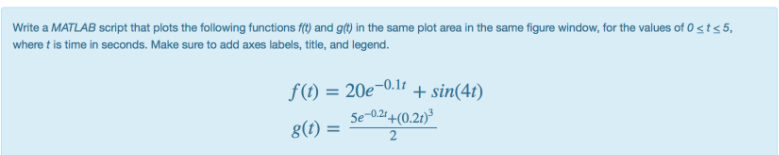
Write a MATLAB script that plots the following functions f(t) and gt) in the same plot area in the same figure window, for the values of Osts5 where t is time in seconds. Make sure to add axes labels, title, and legend. f(f) = 20e-o.lt + S?n(4f) g(t) = Se-o24(0.203
Step by Step Solution
There are 3 Steps involved in it
1 Expert Approved Answer
Step: 1 Unlock

Question Has Been Solved by an Expert!
Get step-by-step solutions from verified subject matter experts
Step: 2 Unlock
Step: 3 Unlock