

Question: Write a MATLAB script that: - Prompt the user to enter the age of the patient. If the age is outside the 4 0 to
Write a MATLAB script that:
Prompt the user to enter the age of the patient. If the age is outside the to range,print a warning message Warning The entered age is outside the study inclusion criteria. Is there another patient? If the answer is YES or Ythe program automatically prompts the user to enter the new patients age. Otherwise, the program
terminatesdoes not perform any of the following tasks Hint: use the MATLAB
command return
Save the data in a D array where the data number you do not have to save the date just a numberindex is in the st column, systolic blood pressure is in the nd column,diastolic blood pressure in the rd column and heart rate data is in the th column.
Once all the data is entered:
Calculate and display the minimum, maximum, average and standard deviation of each of the three data types: systolic blood pressure, diastolic blood pressure and heart rate. Hint: you can use the min, max, mean and std commands in MATLAB
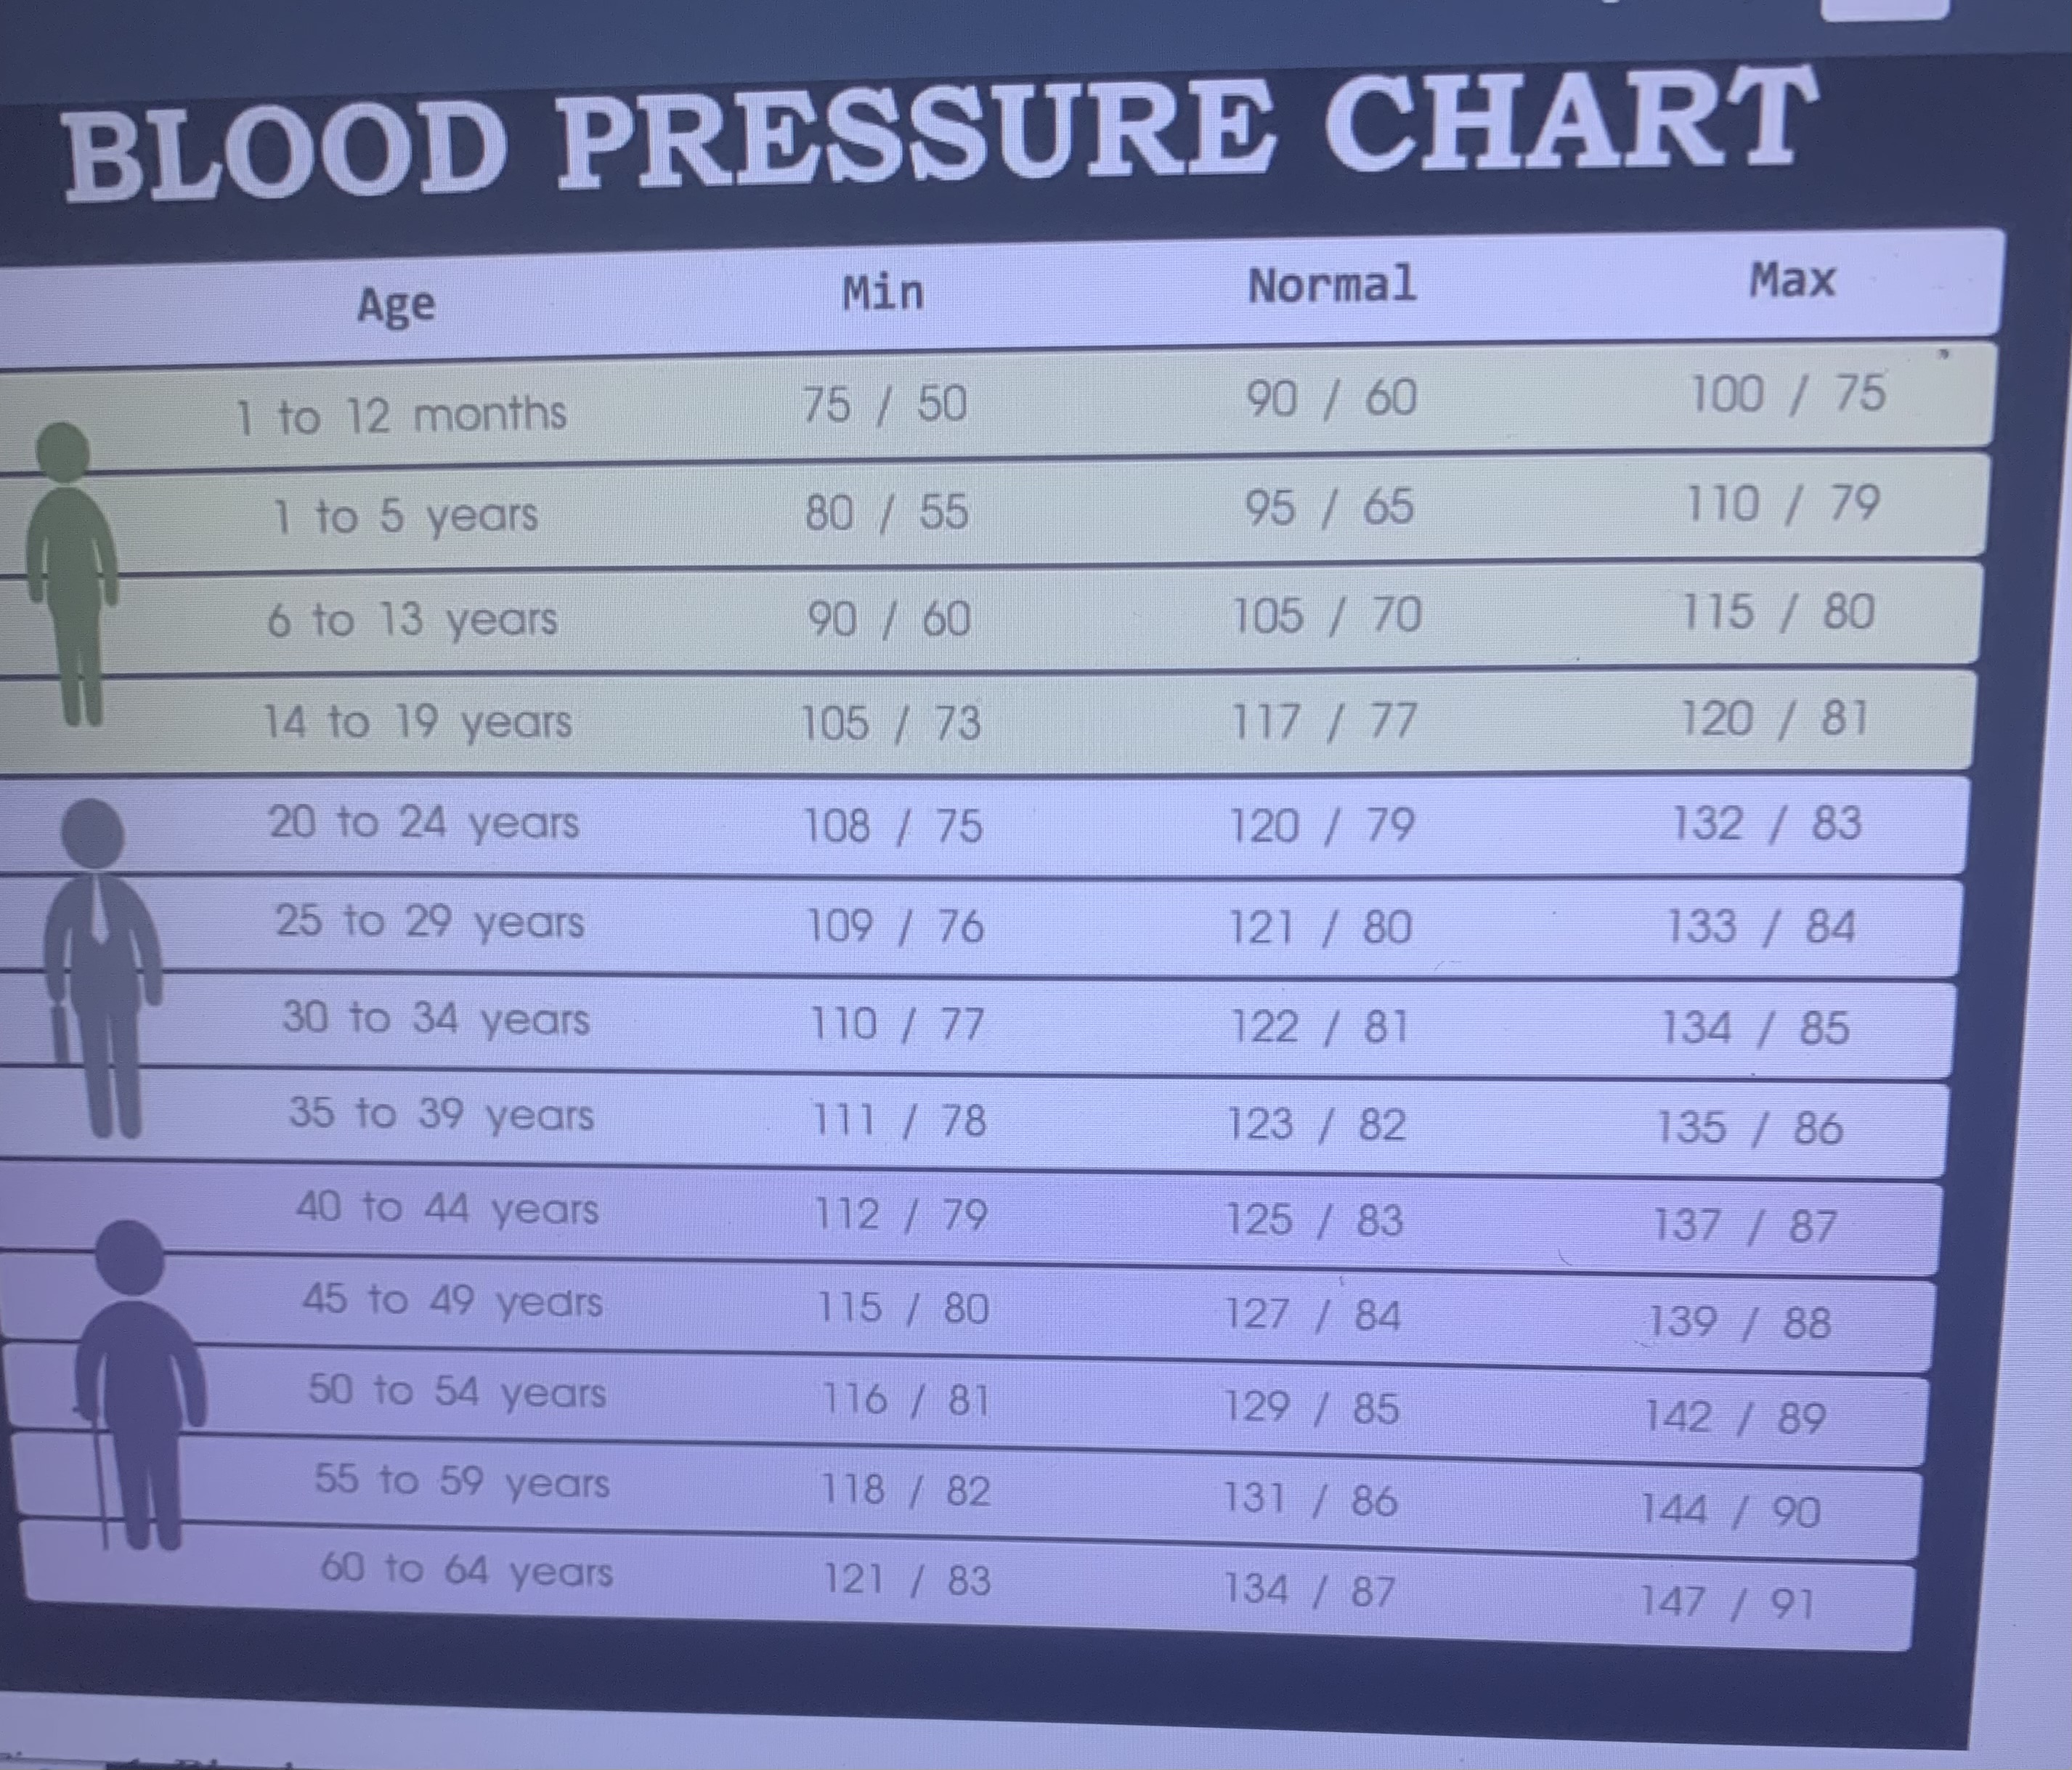
Compare the systolic blood pressure and diastolic blood pressure with the minimum and maximum data from the chart for that age group
For the highest systolic blood pressure, IF it exceeds the value in the chart,
display Warning The systolic blood pressure was data value which
exceeded the maximum value of chart value in the chart OTHERWISE
display a message There are no outofrange high systolic blood pressure
occurrences
Similarly, for the lowest diastolic blood pressure, IF it is lower than the value in the chart, display Warning The diastolic blood pressure was data value which is lower than the minimum value of chart value in the chart OTHERWISE display a message There are no outofrange low diastolic blood pressure occurrences
Finally, plot the blood pressure Systolic and Diastolic versus the data number on a subplot on the left and the heart rate data versus the data number on a second subplot on the right. Add axis labels with units legends and titles for both subplots
Step by Step Solution
There are 3 Steps involved in it
1 Expert Approved Answer
Step: 1 Unlock

Question Has Been Solved by an Expert!
Get step-by-step solutions from verified subject matter experts
Step: 2 Unlock
Step: 3 Unlock