

Question: Write a Matlab script that will do the following: 1- Create a new figure and that will have two separate subgraphs (windows) next to
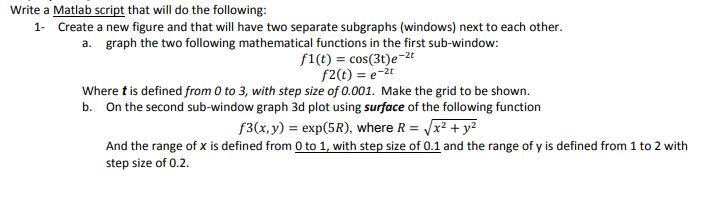
Write a Matlab script that will do the following: 1- Create a new figure and that will have two separate subgraphs (windows) next to each other. a. graph the two following mathematical functions in the first sub-window: f1(t) = cos(3t)e-2 f2(t) = e2t Where t is defined from 0 to 3, with step size of 0.001. Make the grid to be shown. b. On the second sub-window graph 3d plot using surface of the following function f3(x, y) = exp(5R), where R = x + y And the range of x is defined from 0 to 1, with step size of 0.1 and the range of y is defined from 1 to 2 with step size of 0.2.
Step by Step Solution
There are 3 Steps involved in it
1 Expert Approved Answer
Step: 1 Unlock

Question Has Been Solved by an Expert!
Get step-by-step solutions from verified subject matter experts
Step: 2 Unlock
Step: 3 Unlock