

Question: Write a MATLABprogram similar tothe first example program that produces avector ofrandom numbers that are uniformly distributed between-3 and 7 . UseM = 50000 andDx=
Write a MATLABprogram similar tothe first example program that produces avector ofrandom numbers that are uniformly distributed between-3 and 7. UseM = 50000 andDx= 0.1.Includea subroutine in your program that estimates the probability that the randomvariable is between 0 and 2. Compare this to the theoretical value. Plot the estimated pdfon an x-axis that goesfrom-5 to 9.Inyour plot,include theactual pdf ofa randomvariable that is uniformlydistributed between-3 and 7:
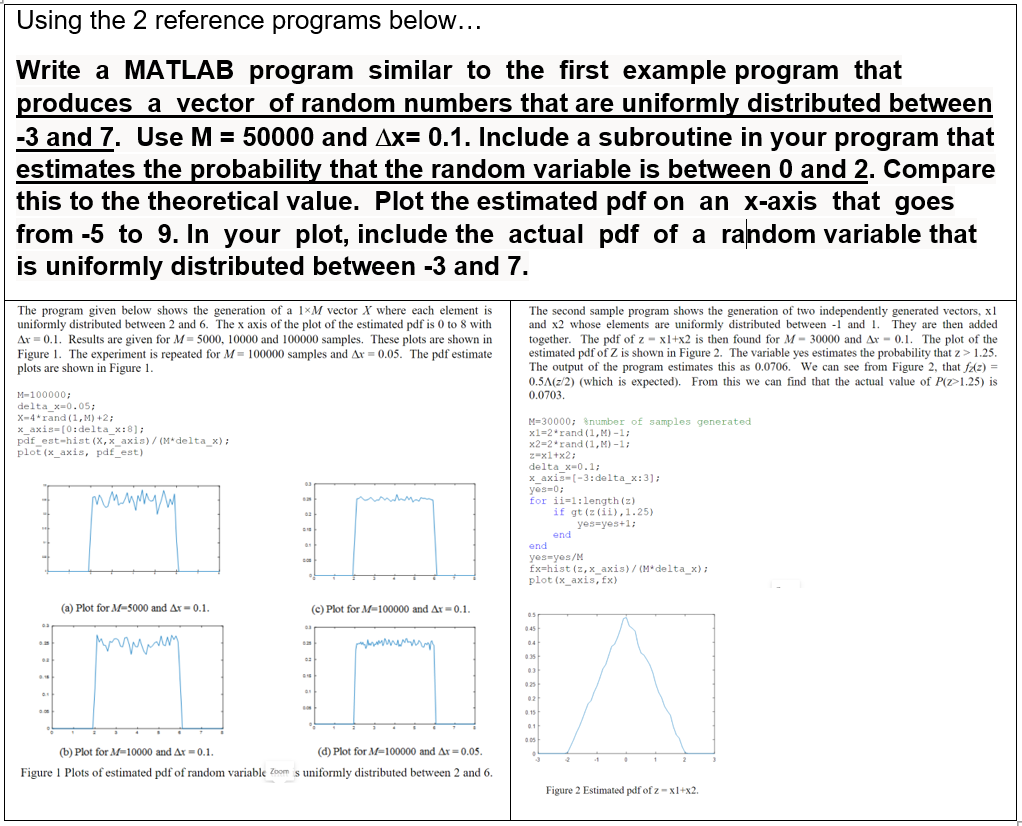
Using the 2 reference programs below... Write a MATLAB program similar to the first example program that produces a vector of random numbers that are uniformly distributed between -3 and 7. Use M = 50000 and Ax= 0.1. Include a subroutine in your program that estimates the probability that the random variable is between 0 and 2. Compare this to the theoretical value. Plot the estimated pdf on an x-axis that goes from -5 to 9. In your plot, include the actual pdf of a random variable that is uniformly distributed between -3 and 7. The program given below shows the generation of a 1xM/ vector X where each element is The second sample program shows the generation of two independently generated vectors, x1 uniformly distributed between 2 and 6. The x axis of the plot of the estimated pdf is 0 to 8 with and x2 whose elements are uniformly distributed between -I and 1. They are then added Ar = 0.1. Results are given for M = 5000, 10000 and 100000 samples. These plots are shown in together. The pdf of z - x1+x2 is then found for M - 30000 and Ar - 0.1. The plot of the Figure 1. The experiment is repeated for M = 100000 samples and Ar = 0.05. The pdf estimate estimated pdf of Z is shown in Figure 2. The variable yes estimates the probability that z > 1.25. plots are shown in Figure 1. The output of the program estimates this as 0.0706. We can see from Figure 2, that fz(2) = 0.5A(z/2) (which is expected). From this we can find that the actual value of P(z>1.25) is M-100000; 0.0703. delta_*=0. 05; X-4 * rand (1, M) +2; M=30000, number of samples generated x_axis=[0: delta_x:8] ; x1=2 * rand (1, M) -1; pdf_est-hist (X, x_axis) / (M*delta_x) ; x2=2 * rand (1, M) -1; plot (x_axis, pdf_est) z=x1+x2; delta_x=0.1; x axis= [-3 :delta_x:3]; yes=0; for ii=1: length (z) if gt (z (ii) , 1.25) yes=yes+1; end end yes=yes/N fx=hist (z, x_axis) / (M*delta_x); plot (x_axis, fx) (a) Plot for A-5000 and Ar = 0.1. (c) Plot for Af=100000 and Ar = 0.1. 6 45 8 15 (b) Plot for A=10000 and Ar = 0.1. (d) Plot for A=100000 and Ar = 0.05. Figure 1 Plots of estimated pdf of random variable Zoom s uniformly distributed between 2 and 6. Figure 2 Estimated pdf of z - x1+x2
Step by Step Solution
There are 3 Steps involved in it

Get step-by-step solutions from verified subject matter experts