

Question: write a paragraph for each chart to describe the chart ASSETS TREASURY BILLS 400 5.000.00 4,500.00 4.000.00 3,500.00 3.000.00 2.500.00 2.000.00 1,300.00 1.000.00 500.00 0.00
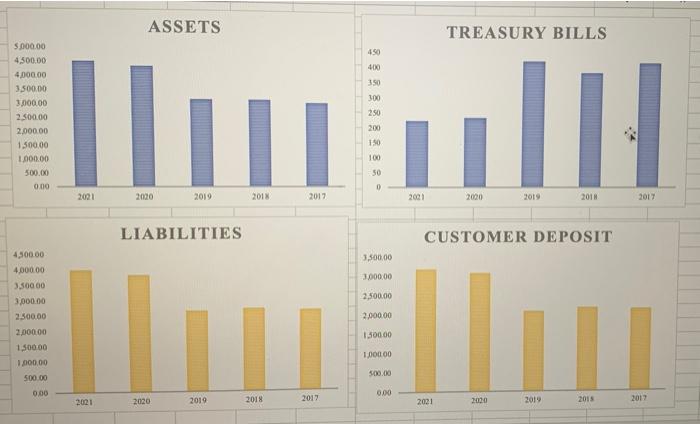
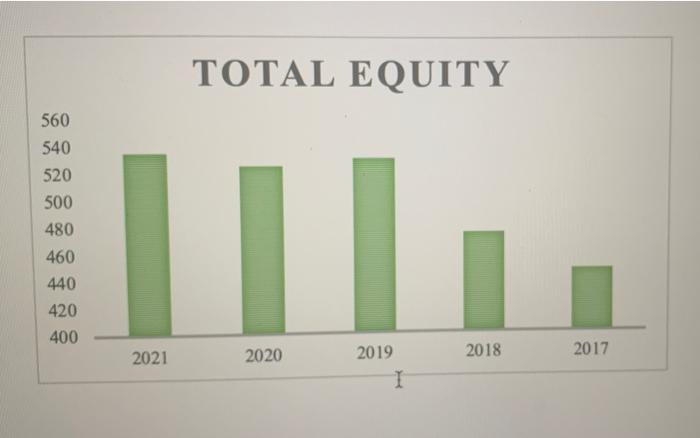
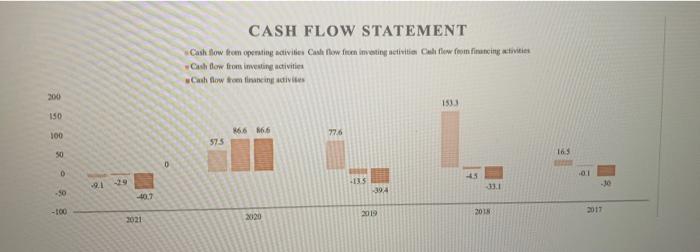
ASSETS TREASURY BILLS 400 5.000.00 4,500.00 4.000.00 3,500.00 3.000.00 2.500.00 2.000.00 1,300.00 1.000.00 500.00 0.00 350 300 250 200 III 150 100 50 0 2001 2020 2019 2013 2017 2001 2000 2019 2018 2017 LIABILITIES CUSTOMER DEPOSIT 3,500.00 3.000,00 4,300.00 4,000.00 3.50000 3.000.00 2.500.00 2,500.00 2.000.00 1.300.00 100000 2.000.00 1,500.00 1000.00 500.00 0.00 500.00 0.00 2021 2020 2019 2018 2017 2021 2000 2019 2015 2012 TOTAL EQUITY 560 540 520 500 480 460 440 420 400 2021 2020 2019 2018 2017 CASH FLOW STATEMENT Cash flow from operating activities Case Now fioen investing netivities Cul flow from financing wives Cash flow from investing activities Cash flow from financing activites 200 1533 150 100 866 66 776 575 50 16 0 D 101 115 -394 33.1 40.7 2010 2018 120
Step by Step Solution
There are 3 Steps involved in it

Get step-by-step solutions from verified subject matter experts