

Question: Write a paragraph for these two scatter plots (Fig1) and (Fig 2) and state their main results and state the meaning of each of their
Write a paragraph for these two scatter plots (Fig1) and (Fig 2) and state their main results and state the meaning of each of their R squares and compare each linear data to each other in each figure ( differences in members who exercise regularly at their first biceps curl and biceps curl at fatigue) and ( differences in members who exercise infrequently within the first biceps curl and biceps curl at fatigue). and at the end compare the 2 scatterplots together for each scatterplot write a big paragraph.
Thanks
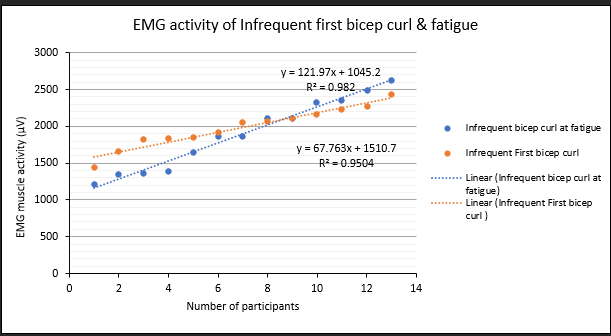
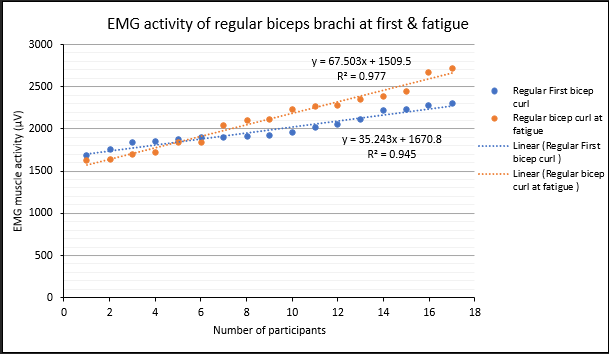
EMG activity of Infrequent first bicep curl & fatigue 3000 y = 121.97x + 1045.2 2500 RZ = 0.982 2000 Infrequent bicep curl at fatigue y = 67.763x + 1510.7 . Infrequent First bicep curl 1500 R= = 0.9504 EMG muscle activity (LV) mmmmont Linear (Infrequent bicep curl at fatigue) 1000 Linear (Infrequent First bicep curl ) 500 0 2 4 6 8 10 12 14 Number of participantsEMG activity of regular biceps brachi at first & fatigue 3000 y = 67.503x + 1509.5 R= = 0.977 2500 Regular First bicep curl Regular bicep curl at 2000 fatigue y = 35.243x + 1670.8 munmason. Linear [ Regular First R= = 0.945 bicep curl ) EMG muscle activity (IV) 1500 wannamom. Linear [ Regular bicep curl at fatigue } 1000 500 0 0 2 4 6 10 12 14 16 18 Number of participants
Step by Step Solution
There are 3 Steps involved in it

Get step-by-step solutions from verified subject matter experts