

Question: Write a probability analysis for this company 2017 2018 2019 3,253,000 37,189,000 8.75% 17,293,000 86,223,000 20.06% 8,130,000 108,070,000 7.52% % % 3,253,000 99,196,500 3.28% 17,293,000
Write a probability analysis for this company
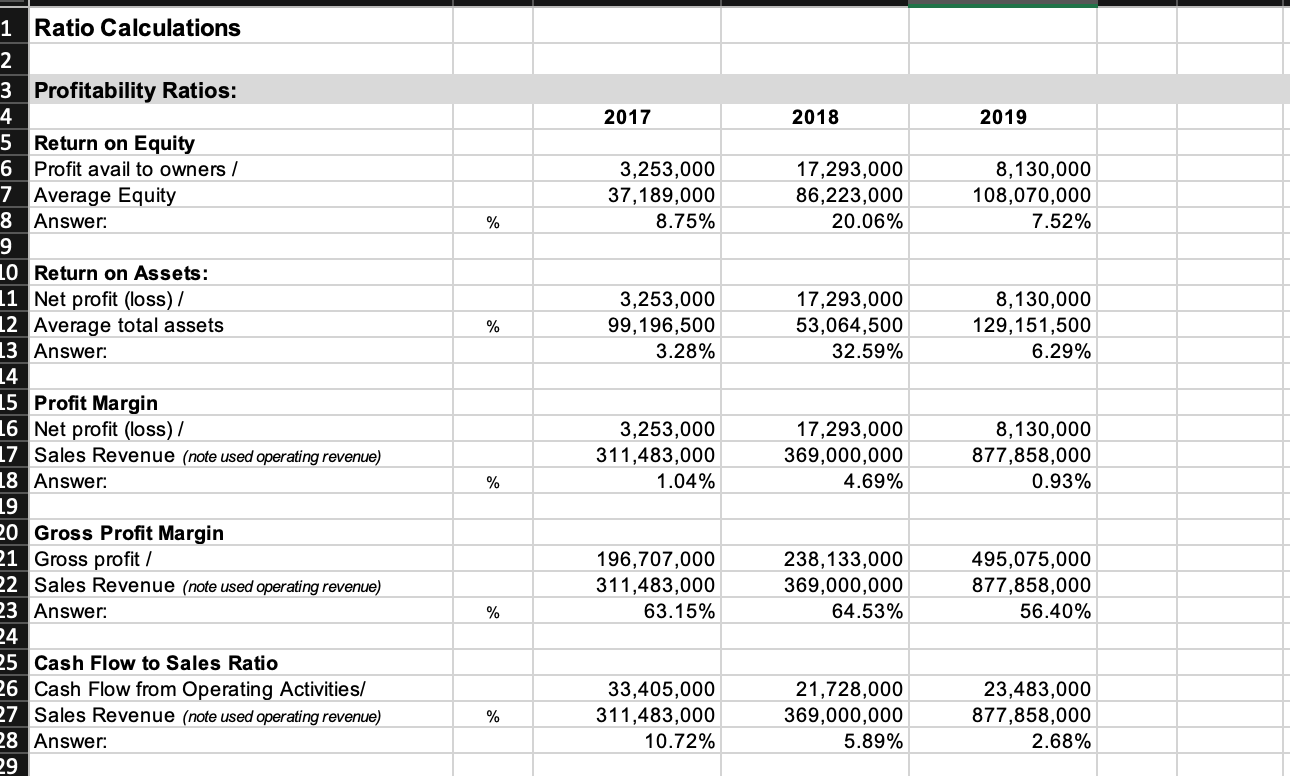
2017 2018 2019 3,253,000 37,189,000 8.75% 17,293,000 86,223,000 20.06% 8,130,000 108,070,000 7.52% % % 3,253,000 99,196,500 3.28% 17,293,000 53,064,500 32.59% 8,130,000 129,151,500 6.29% 1 Ratio Calculations 2 3 Profitability Ratios: 4 5 Return on Equity 6 Profit avail to owners/ 7 Average Equity 8 Answer: 9 LO Return on Assets: 11 Net profit (loss) / 12 Average total assets 13 Answer: 14 15 Profit Margin 16 Net profit (loss) / 17 Sales Revenue (note used operating revenue) 18 Answer: 19 20 Gross Profit Margin 21 Gross profit / 22 Sales Revenue (note used operating revenue) 23 Answer: 24 25 Cash Flow to Sales Ratio 26 Cash Flow from Operating Activities/ 27 Sales Revenue (note used operating revenue) 28 Answer: 29 3,253,000 311,483,000 1.04% 17,293,000 369,000,000 4.69% 8,130,000 877,858,000 0.93% % 196,707,000 311,483,000 63.15% 238,133,000 369,000,000 64.53% 495,075,000 877,858,000 56.40% % % 33,405,000 311,483,000 10.72% 21,728,000 369,000,000 5.89% 23,483,000 877,858,000 2.68%
Step by Step Solution
There are 3 Steps involved in it

Get step-by-step solutions from verified subject matter experts