

Question: Write a program that will generate the following plot. It contains 6 subplot. The top row figures are line plots and the bottom row figures
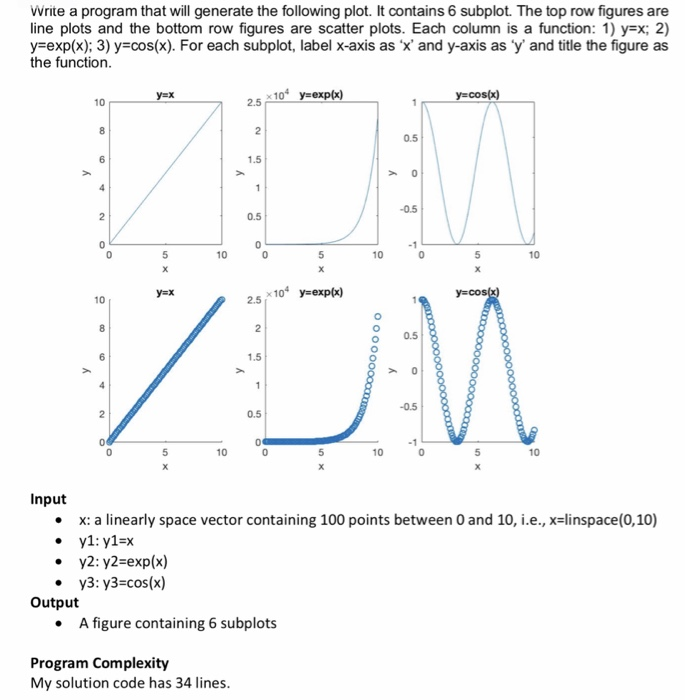
Write a program that will generate the following plot. It contains 6 subplot. The top row figures are line plots and the bottom row figures are scatter plots. Each column is a function : 1) y-x; 2) y exp(x); 3) y cos(x). For each subplot, label x-axis as 'x' and y-axis as y and title the figure as the function x 104 y exp(x) 2.5 10 0.5 1.5 0.5 10 10 10 x 104 y exp(x) 2.5 10 o 0.5 1.5 0.5 5 10 5 10 10 Input x: a linearly space vector containing 100 points between 0 and 10, i.e., x linspace(0,10) y2: y2-exp(x) . y3: y3-cos(x) Output .A figure containing 6 subplots Program Complexity My solution code has 34 lines
Step by Step Solution
There are 3 Steps involved in it
1 Expert Approved Answer
Step: 1 Unlock

Question Has Been Solved by an Expert!
Get step-by-step solutions from verified subject matter experts
Step: 2 Unlock
Step: 3 Unlock