

Question: Write a program to draw a text-based graph of a mathematical function f(x). Use axis limits of -10 to 10 and only plot discrete points
Write a program to draw a text-based graph of a mathematical function f(x).
Use axis limits of -10 to 10 and only plot discrete points i.e. points with integer value ordinates.
Sample I/O:
Enter a function f(x): x+2
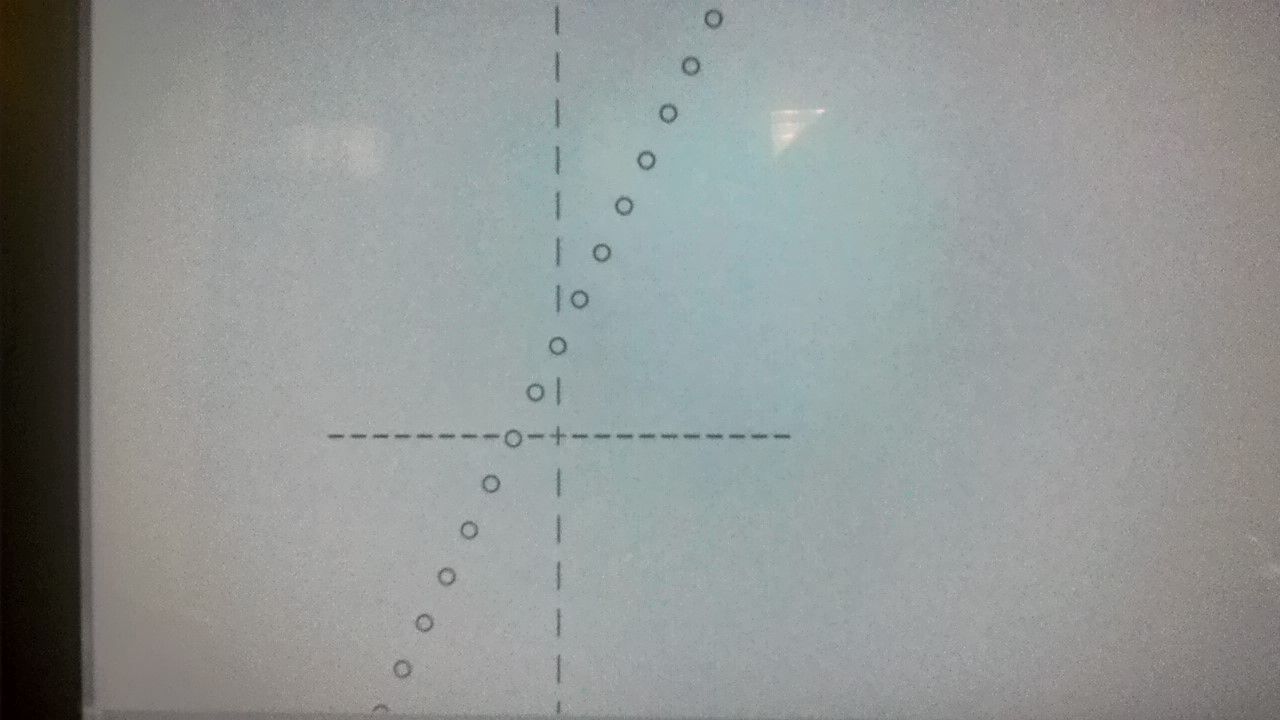
Use nested loops to print the entire area of the graph (i.e. an outer loop for rows and an inner one for columns), keeping track of the current x and y values. Whenever the (rounded) value of the function f(x), entered by the user, is equal to the current y value, output "o" (small letter Oh), otherwise, output either the appropriate axis character or a space.
NOTE: Remember to import math to enable the use of some mathematical functions.
How should the program support the entering of arbitrary functions?
- Obtain user input in the form of a string, then within the inner loop,
- whenever f(x) is to be calculated, use the Python eval function on that string.
Step by Step Solution
There are 3 Steps involved in it

Get step-by-step solutions from verified subject matter experts