

Question: write a r code for these diagrams 4 A. Sheple species modela 1 N Ndr N Fig. 1.1. Per capita prowth rate. IN dt N

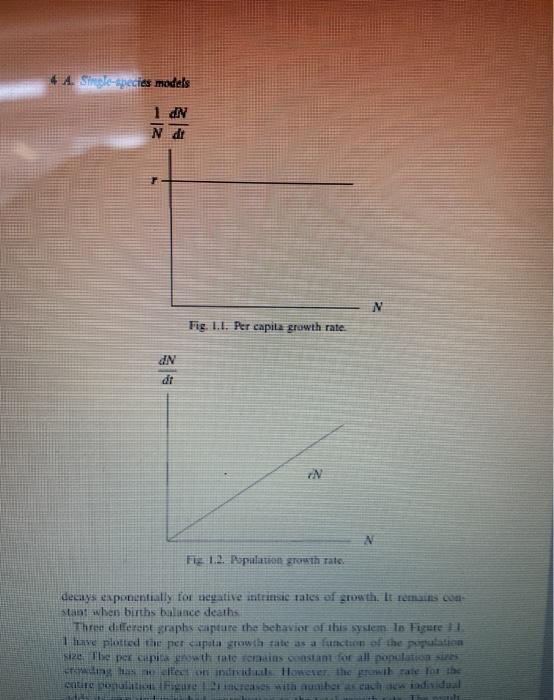
write a r code for these diagrams 4 A. Sheple species modela 1 N Ndr N Fig. 1.1. Per capita prowth rate. IN dt N M Fig 1.2. Population growth rate. 44. Single-species models 1 DN Ndt Fig. 1.1. Per capita growth rate. UN dit Fe 1.2. Population growth rats decays exponentially for negative intrittsie rates of growth. It remis Con stant when births balance deaths Three diferent graphs capture the behavior of this system to Figure !! plotted the per capota growth rate as a function of the population $24. The per capita nwth rate remains coastant for all population sizes is les tendals Tonstut the wik rate for the entic Fences with unibertsach individual write a r code for these diagrams 4 A. Sheple species modela 1 N Ndr N Fig. 1.1. Per capita prowth rate. IN dt N M Fig 1.2. Population growth rate. 44. Single-species models 1 DN Ndt Fig. 1.1. Per capita growth rate. UN dit Fe 1.2. Population growth rats decays exponentially for negative intrittsie rates of growth. It remis Con stant when births balance deaths Three diferent graphs capture the behavior of this system to Figure !! plotted the per capota growth rate as a function of the population $24. The per capita nwth rate remains coastant for all population sizes is les tendals Tonstut the wik rate for the entic Fences with unibertsach individual
Step by Step Solution
There are 3 Steps involved in it

Get step-by-step solutions from verified subject matter experts