

Question: Write a r code for this diagram VIVO N() (1.12) (M- No)ema + No Notice that this includes the solutions N(t) = 0 (taking No
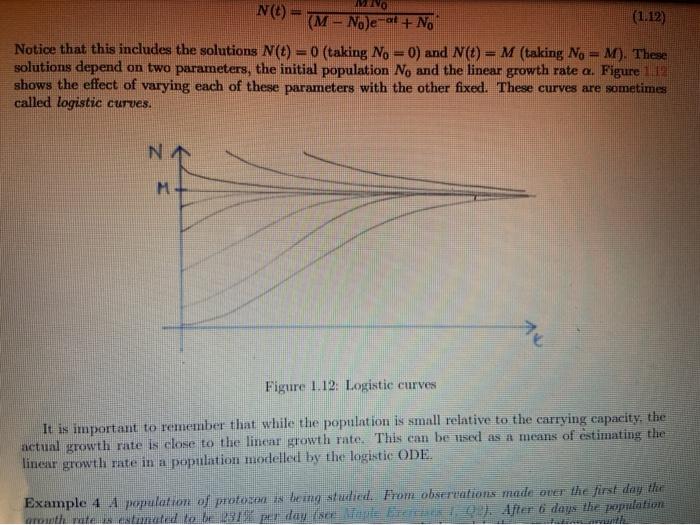
VIVO N() (1.12) (M- No)ema + No Notice that this includes the solutions N(t) = 0 (taking No =0) and N = M (taking No = m). These solutions depend on two parameters, the initial population N, and the linear growth rate a. Figure 112 shows the effect of varying each of these parameters with the other fixed. These curves are sometimes called logistic curves. NN M Figure 1.12: Logistic curves It is important to remember that while the population is small relative to the carrying capacity, the actual growth rate is close to the linear growth rate. This can be used as a means of estimating the linear growth rate in a population modelled by the logistic ODE. Example 4 A population of protesen wurdeingaluded. From observations made over the first day the route te timated to be Big per day (see lapte Breite29). After 6 days the population 12 The Logistic Population Model allows us to integrate it +c=5., - (+/4) - 3 (1987 bg(x=) dx (K-1) when c Is the constant of Integration If the population stze at time t=0 Is x0, substitution of the initial condition *(0) = gives (108.99 10g(K - x)). We now have (109x log(K x)) = (log.xo -log(K xo)). log = +log KO x(K- log XOKX XKU XnKX KO HE Further algebraic simplinicalion gives x{KX) xo(K nje Kupator x{K - 20 Exte") Krne" and nnally Krom xD R K- The above solution is valid only if ok so that the logarithms obtained in the integration at denned To obtain the solution without this estriction our inte gration should have given logarithms or absolute values. Nevertheless, the formula (17) for the solution of the logistic equation is valid for all as could be verned by a more careful analysis The expression d. 7 for the solution of the log la valu problem shows that the population size x approaches the limit ka - The value is called the carrying capacay of the population because it presents the poput tions that available it sources can conting to support the value o calked the laring the because it represents the per capita growth rate achieved at the populations were change beim The Ristic meditstapanitia prowth for the case in the Testime that the seat the pain authoriti This teremthesohened bebas HO VIVO N() (1.12) (M- No)ema + No Notice that this includes the solutions N(t) = 0 (taking No =0) and N = M (taking No = m). These solutions depend on two parameters, the initial population N, and the linear growth rate a. Figure 112 shows the effect of varying each of these parameters with the other fixed. These curves are sometimes called logistic curves. NN M Figure 1.12: Logistic curves It is important to remember that while the population is small relative to the carrying capacity, the actual growth rate is close to the linear growth rate. This can be used as a means of estimating the linear growth rate in a population modelled by the logistic ODE. Example 4 A population of protesen wurdeingaluded. From observations made over the first day the route te timated to be Big per day (see lapte Breite29). After 6 days the population 12 The Logistic Population Model allows us to integrate it +c=5., - (+/4) - 3 (1987 bg(x=) dx (K-1) when c Is the constant of Integration If the population stze at time t=0 Is x0, substitution of the initial condition *(0) = gives (108.99 10g(K - x)). We now have (109x log(K x)) = (log.xo -log(K xo)). log = +log KO x(K- log XOKX XKU XnKX KO HE Further algebraic simplinicalion gives x{KX) xo(K nje Kupator x{K - 20 Exte") Krne" and nnally Krom xD R K- The above solution is valid only if ok so that the logarithms obtained in the integration at denned To obtain the solution without this estriction our inte gration should have given logarithms or absolute values. Nevertheless, the formula (17) for the solution of the logistic equation is valid for all as could be verned by a more careful analysis The expression d. 7 for the solution of the log la valu problem shows that the population size x approaches the limit ka - The value is called the carrying capacay of the population because it presents the poput tions that available it sources can conting to support the value o calked the laring the because it represents the per capita growth rate achieved at the populations were change beim The Ristic meditstapanitia prowth for the case in the Testime that the seat the pain authoriti This teremthesohened bebas HO
Step by Step Solution
There are 3 Steps involved in it

Get step-by-step solutions from verified subject matter experts