Question: Write a R script 4. The Capital Asset Price Model (CAPM) is a financial model that attempts to predict the rate of return on a
Write a R script
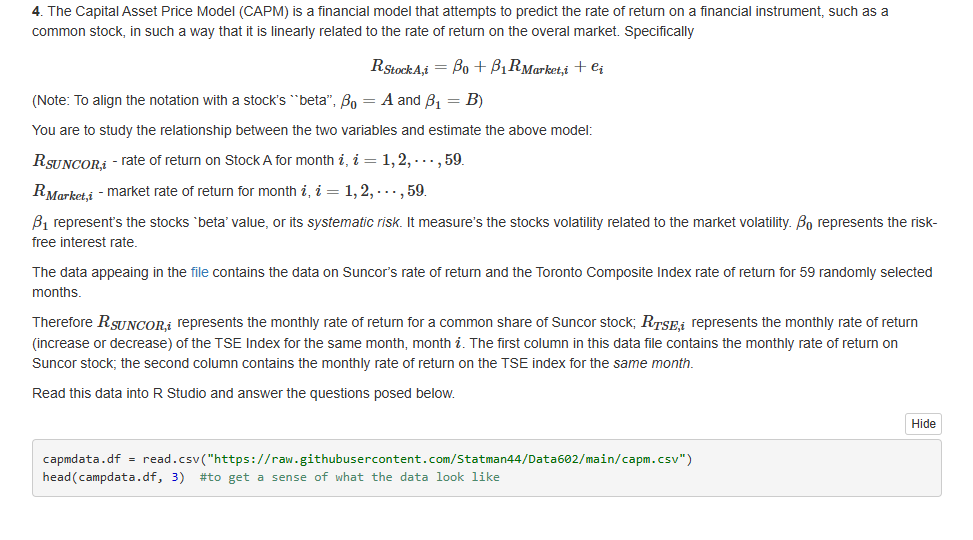
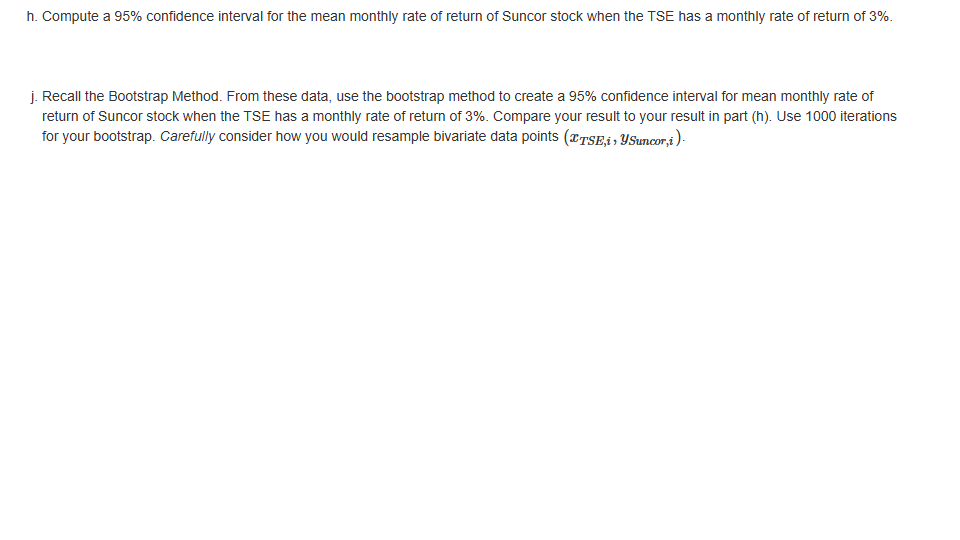
4. The Capital Asset Price Model (CAPM) is a financial model that attempts to predict the rate of return on a financial instrument, such as a common stock, in such a way that it is linearly related to the rate of return on the overal market. Specifically RStockA,i = Bo + BIRMarket,i + ei (Note: To align the notation with a stock's "beta", Bo = A and B, = B) You are to study the relationship between the two variables and estimate the above model: RSUNCOR,i - rate of return on Stock A for month i, i = 1, 2, . .., 59. R Market,i - market rate of return for month i, i = 1, 2, . .., 59. B1 represent's the stocks "beta' value, or its systematic risk. It measure's the stocks volatility related to the market volatility. Bo represents the risk- free interest rate. The data appeaing in the file contains the data on Suncor's rate of return and the Toronto Composite Index rate of return for 59 randomly selected months. Therefore RUNCOR, represents the monthly rate of return for a common share of Suncor stock; Rigg, represents the monthly rate of return (increase or decrease) of the TSE Index for the same month, month . The first column in this data file contains the monthly rate of return on Suncor stock; the second column contains the monthly rate of return on the TSE index for the same month. Read this data into R Studio and answer the questions posed below. Hide capmdata. df = read. cav("https://raw.githubusercontent. com/Statman44/Data602/main/capm. cav") head (campdata.df, 3) #to get a sense of what the data look likeh. Compute a 95% confidence interval for the mean monthly rate of return of Suncor stock when the TSE has a monthly rate of return of 3%. j. Recall the Bootstrap Method. From these data, use the bootstrap method to create a 95% confidence interval for mean monthly rate of return of Suncor stock when the TSE has a monthly rate of return of 3%. Compare your result to your result in part (h). Use 1000 iterations for your bootstrap. Carefully consider how you would resample bivariate data points (trsRi : USuncor.i )
Step by Step Solution
There are 3 Steps involved in it
1 Expert Approved Answer
Step: 1 Unlock
Question Has Been Solved by an Expert!
Get step-by-step solutions from verified subject matter experts
Step: 2 Unlock
Step: 3 Unlock
Students Have Also Explored These Related Finance Questions!