

Question: Write a report that summarizes your investigation. It is preferable to insert computed results and graphs into your report at appropriateplaces. Project A Are SAT
Write a report that summarizes your investigation. It is preferable to insert computed results and graphs into your report at appropriateplaces.
Project A Are SAT Scores Linked? The SAT data collected from a distance learning class is presented on a separate sheet. For purposes of reading the table, the first student's SAT Math score was 680, and his/her SAT Critical Reading score was 780. Using the concepts of Exploratory Data Analysis, learned in class, create a presentation to explore any relationships between SAT Math scores and SAT Reading Scores. Create a frequency table using 5 classes and histograms for both SAT Math and SAT Reading. Create a box and whisker plot, a stem and leaf plot, and one other graph (of your choosing). Include all the descriptive statistics, the mean, median, mode, mid-range, range, standard deviation, variance, IQR. You must work individually and cooperatively on this assignment. Please submit an individual report per student, and one (1) group report. Use any statistical software available to aid you in completing this assignment. REPORT: Write a report that summarizes your investigation. It is preferable to insert computed results and graphs into your report at appropriate places. It is acceptable, but less desirable, to include plots and computer output at the end of your narrative, like appendices. Try to keep graphs and your commentaries about these graphs together on the same page, if possible, so the reader won't have to flip back and forth when reading your report. Please make sure that all group members contribute equally, and all names must appear on the reportcoversheet.
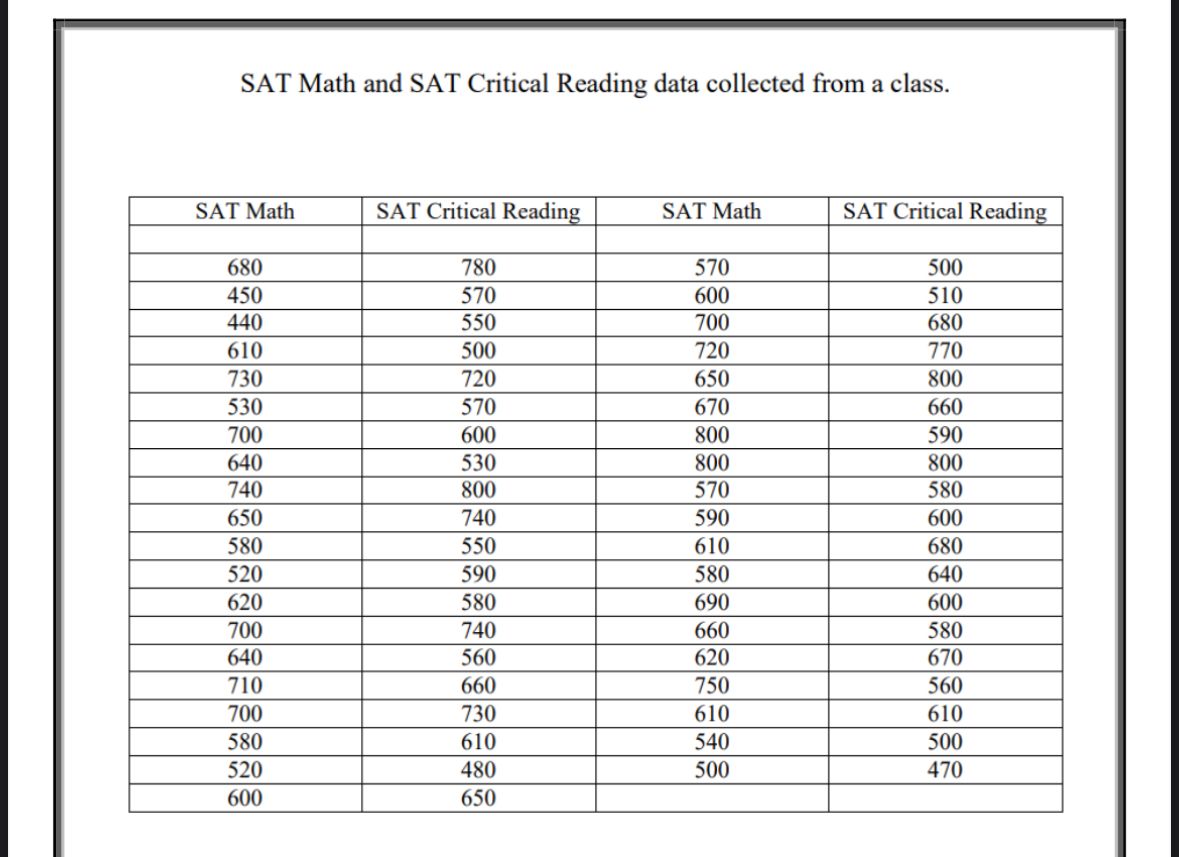
SAT Math and SAT Critical Reading data collected from a class. SAT Math SAT Critical Reading SAT Math SAT Critical Reading 680 780 570 500 450 570 600 510 440 550 700 680 610 500 720 770 730 720 650 800 530 570 670 660 700 600 800 590 640 530 800 800 740 800 570 580 650 740 590 600 580 550 610 680 520 590 580 640 620 580 690 600 700 740 660 580 640 560 620 670 710 660 750 560 700 730 610 610 580 610 540 500 520 480 500 470 600 650
Step by Step Solution
There are 3 Steps involved in it

Get step-by-step solutions from verified subject matter experts