

Question: Write a research question for each of the 3 bivariate analyses ( group means, contingency, corration) using variables from the ZYP bike study which are
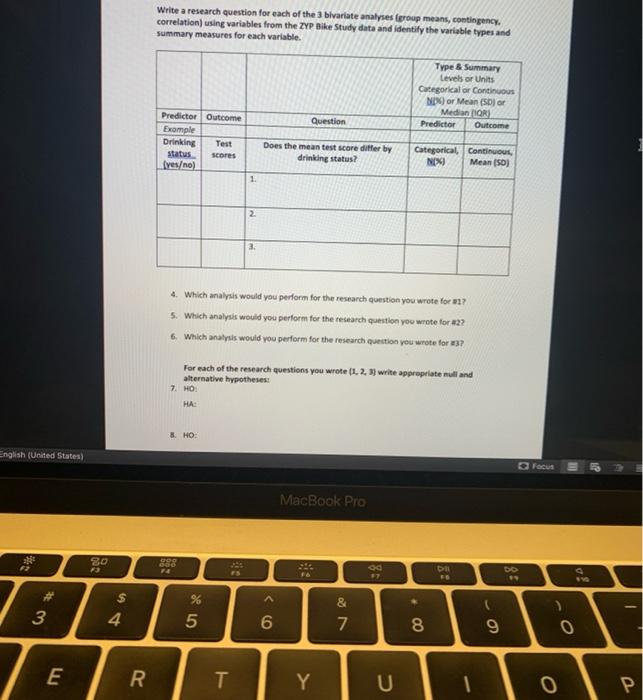
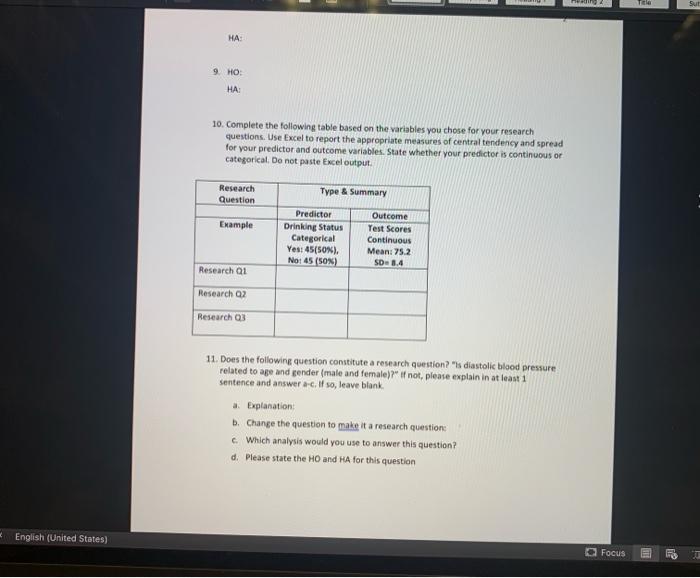
Write a research question for each of the 3 bivariate analyses group means, contingency. correlation) using variables from the ZYP Bike Study data and identify the variable types and summary measures for each variable. Type & Summary Levels or Units Categorical or Continuous NM) or Mean (5) Median OR Predictor Outcome Question Predictor Outcome Example Drinking status scores (yeso) Test Does the mean test score differ by drinking status? Categorical Continuous NX Mean(50) 1. 22 3 4. Which analysis would you perform for the research question you wrote for ? 5. Which analysis would you perform for the research question you wrote for x?? 6. Which analysis would you perform for the research question you wrote for ? For each of the research questions you wrote (1, 2, 3 write appropriate null and alternative hypotheses 7. HO HA: 8 HO: English (United States MacBook Pro 80 999 000 od DEL A $ 4 % 5 ) - 3 6 & 7 8 9 0 E R T Y U 0 Tele HA 9 HO HA 10. Complete the following table based on the variables you chose for your research questions. Use Excel to report the appropriate measures of central tendency and spread for your predictor and outcome variables. State whether your predictoris continuous or categorical. Do not paste Excel output Research Question Type & Summary Example Predictor Drinking Status Categorical Yes: 45(50%) Not 45 (50%) Outcome Test Scores Continuous Mean: 75.2 SD.3.4 Research 01 Research 02 Research 03 11. Does the following question constitute a research questions diastolic blood pressure related to age and gender (male and female)" if not, please explain in at least 1 sentence and answer a-c. If so, leave blank Explanation: . Change the question to make it a research question: c Which analysis would you use to answer this question? d. Please state the HO and HA for this question English (United States) O Focus Write a research question for each of the 3 bivariate analyses group means, contingency. correlation) using variables from the ZYP Bike Study data and identify the variable types and summary measures for each variable. Type & Summary Levels or Units Categorical or Continuous NM) or Mean (5) Median OR Predictor Outcome Question Predictor Outcome Example Drinking status scores (yeso) Test Does the mean test score differ by drinking status? Categorical Continuous NX Mean(50) 1. 22 3 4. Which analysis would you perform for the research question you wrote for ? 5. Which analysis would you perform for the research question you wrote for x?? 6. Which analysis would you perform for the research question you wrote for ? For each of the research questions you wrote (1, 2, 3 write appropriate null and alternative hypotheses 7. HO HA: 8 HO: English (United States MacBook Pro 80 999 000 od DEL A $ 4 % 5 ) - 3 6 & 7 8 9 0 E R T Y U 0 Tele HA 9 HO HA 10. Complete the following table based on the variables you chose for your research questions. Use Excel to report the appropriate measures of central tendency and spread for your predictor and outcome variables. State whether your predictoris continuous or categorical. Do not paste Excel output Research Question Type & Summary Example Predictor Drinking Status Categorical Yes: 45(50%) Not 45 (50%) Outcome Test Scores Continuous Mean: 75.2 SD.3.4 Research 01 Research 02 Research 03 11. Does the following question constitute a research questions diastolic blood pressure related to age and gender (male and female)" if not, please explain in at least 1 sentence and answer a-c. If so, leave blank Explanation: . Change the question to make it a research question: c Which analysis would you use to answer this question? d. Please state the HO and HA for this question English (United States) O Focus
Step by Step Solution
There are 3 Steps involved in it

Get step-by-step solutions from verified subject matter experts