

Question: Write a script file to make the plot as shown with single plot command and different color for each curve. Use 100 points for the
Write a script file to make the plot as shown with single plot command and different color for each curve. Use 100 points for the domain. The line styles, axes labels, axes limits, and legend must be the same as that shown in Figure.
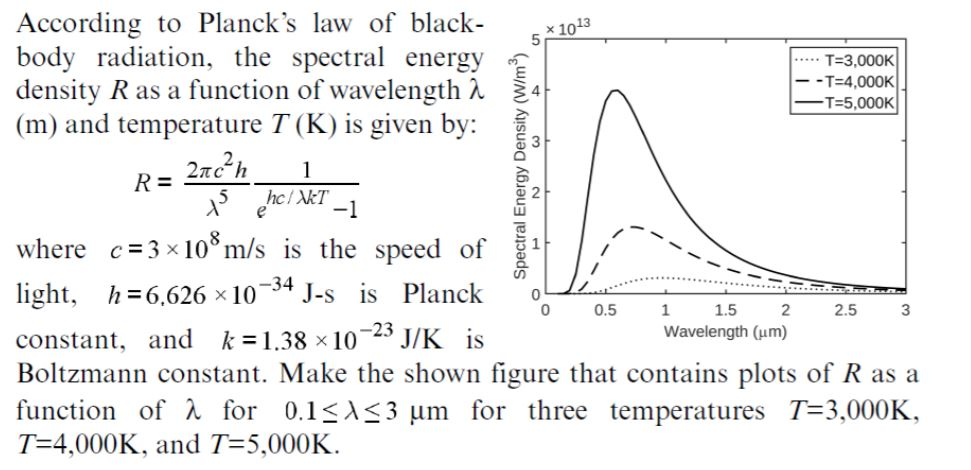
According to Planck's law of black x 10 13 body radiation, the spectral energy T 3,000K T-4,000K density R as a function of wavelength E4 T-5,000K (m) and temperature T (K) is given by: where c 3x 10 m/s is the speed of 1 light 34 s is Planck 0LLi h -6.626 x 10 0.5 1.5 2.5 constant, and K-1.38 x 10 23 J/K is Wavelength (um) Boltzmann constant. Make the shown figure that contains plots of R as a function of for 0.1 SAS3 um for three temperatures 3,000K, T-4,000K, and T-5,000K
Step by Step Solution
There are 3 Steps involved in it

Get step-by-step solutions from verified subject matter experts