

Question: Write a script that plots the functions f (t) and g(t) over the domain [0, 61 in the same graph (Figure), using a reasonable resolution.
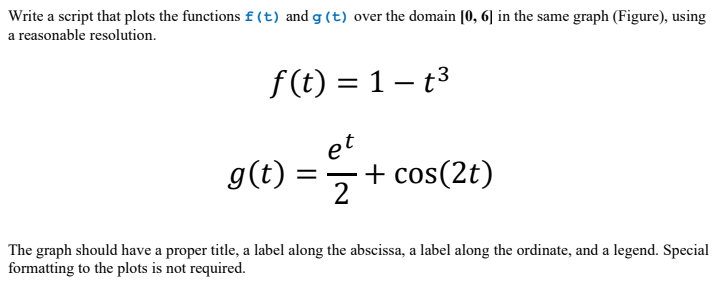
Write a script that plots the functions f (t) and g(t) over the domain [0, 61 in the same graph (Figure), using a reasonable resolution. f(t) = 1 t3 et g(t) = + cos(2t) The graph should have a proper title, a label along the abscissa, a label along the ordinate, and a legend. Special formatting to the plots is not required
Step by Step Solution
There are 3 Steps involved in it
1 Expert Approved Answer
Step: 1 Unlock

Question Has Been Solved by an Expert!
Get step-by-step solutions from verified subject matter experts
Step: 2 Unlock
Step: 3 Unlock