Question: write a summary base off this income statement chart ,for the restaurant steak n shake Steak n Shake Orangeburg Income Statement For The Year Ending
write a summary base off this income statement chart ,for the restaurant steak n shake
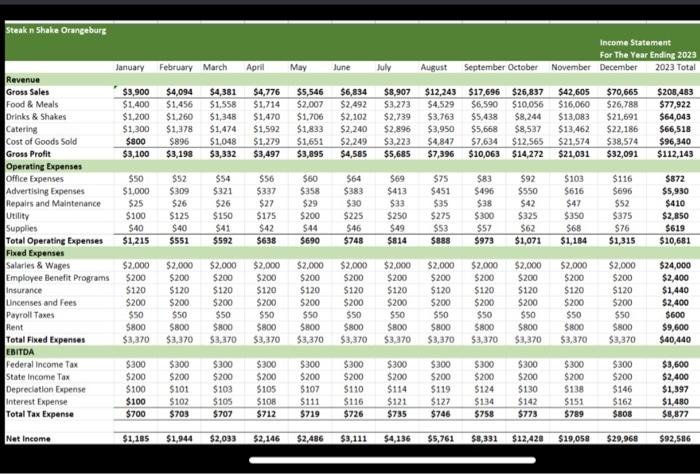
Steak n Shake Orangeburg Income Statement For The Year Ending 2023 November December 2023 Total January February March April May June July August September October $3,900 $1,400 $1,200 $1,300 $800 $3,100 $4,094 $1.456 $1,260 $1,378 $896 $3,198 $4,381 $1,558 $1,348 $1,474 $1,048 $3,332 $4,776 $1,714 $1,470 $1,592 $1.279 $3,497 $5,546 $2,007 $1,706 $1,833 $1,651 $3,895 $6,834 $2,492 $2,102 $2,240 $2,249 $4,585 $8,907 $3.273 $2,739 $2.896 $3,223 $5,685 $12,243 $17,696 $26,837 $4.529 $6,590 $10,056 $3.763 $5,438 $8,244 $3,950 $5,668 $8,537 $4,847 57.634 $12,565 $7,396 $10,063 $14,272 $42,605 $16,060 $13,083 $13,462 $21,574 $21,031 $70,665 $26.788 $21,691 $22,186 $38,574 $32,091 $208,483 $77,922 $64,043 $66,518 $96,340 $112,143 $50 $1,000 $25 $100 $40 $1,215 $52 $309 $26 $125 $40 $551 $54 $321 $26 $150 $41 $592 $56 $337 $27 $175 $42 $638 $60 $358 $29 $200 $44 $690 $64 $383 $30 $225 $46 $748 $69 $413 $33 $250 $49 $814 $75 $451 $35 $275 $83 $496 $38 $300 $57 $973 $92 $550 $42 $325 $62 $1,071 $103 $616 $47 $350 $68 $1,184 $116 $696 $52 $375 $76 $1,315 $872 $5,930 $410 $2,850 $619 $10,681 $53 $888 Revenue Gross Sales Food & Meals Drinks & Shakes Catering Cost of Goods Sold Gross Profit Operating Expenses Office Expenses Advertising Expenses Repairs and Maintenance Utility Supplies Total Operating Expenses Fixed Expenses Salaries & Wages Employee Benefit Programs Insurance Lincenses and Fees Payroll Taxes Rent Total Fixed Expenses EBITDA Federal Income Tax State Income Tax Depreciation Expense Interest Expense Total Tax Expense $2,000 $200 $120 $2,000 $200 $120 $200 $50 $800 $3,370 $2,000 $200 $120 $200 $50 $800 $3.370 $2,000 $200 $120 $200 $50 $800 $3,370 $2,000 $200 $120 $200 $50 $800 $3,370 $2.000 $200 $120 $200 $50 5800 $3,370 $2,000 $200 $120 $200 $50 $800 $3,370 $2.000 $200 $120 $200 $50 $800 $3,370 $200 $2.000 $200 $120 $200 $50 $800 $3,370 $2,000 $200 $120 $200 $50 $800 $3,370 $2,000 $200 $120 $200 $50 $800 $3,370 $2,000 $200 $120 $200 $50 $800 $3,370 $24,000 $2,400 $1,440 $2,400 $600 $9,600 $40,440 $50 $800 $3,370 $300 $200 $100 $100 $700 $300 $200 $101 $102 $703 $300 $200 S103 $105 $707 $300 $200 $105 $10B $712 $300 $200 $107 $111 $719 $300 $200 $110 $116 $726 $300 $200 $114 $121 $735 $300 $200 $119 $127 $746 $300 $200 $124 $134 $758 $300 $200 $130 $142 $773 $300 $200 $138 5151 $789 $300 $200 $146 $162 $808 $3,600 $2,400 $1,397 $1,480 $8,877 Net Income $1,185 $1,944 $2,033 $2,146 $2,486 $3,111 $4,136 $5,761 $8,331 $12,420 $19,058 $29,968 $92,586