

Question: Write a working R programming code - Assume that 9 IC observations have been collected for phase II monitoring of a production process. These observations
Write a working R programming code -
Assume that 9 IC observations have been collected for phase II monitoring of a production process. These observations along with the first 21 phase II observations are presented below. 11.528, 8.990, 9.590, 9.648, 16.807, 14.850, 10.708, 7.042, 5.427, 10.107, 0.029, 9.836, 6.807, 12.428, 18.920, 7.535, 11.330, 3.883, 8.874, 16.850, 9.627, 10.887, 21.789, 12.482, 12.741, 13.236, 18.913, 15.113, 16.006, 17.006
Use the CPD control chart to monitor the process mean (hint: you can use the recursive equations in the slides). In the control chart, use alpha = 0.05, and you can determine the control limit hn computed by the approximation formula based on Hawkins et al. 2003 as discussed in the slides.
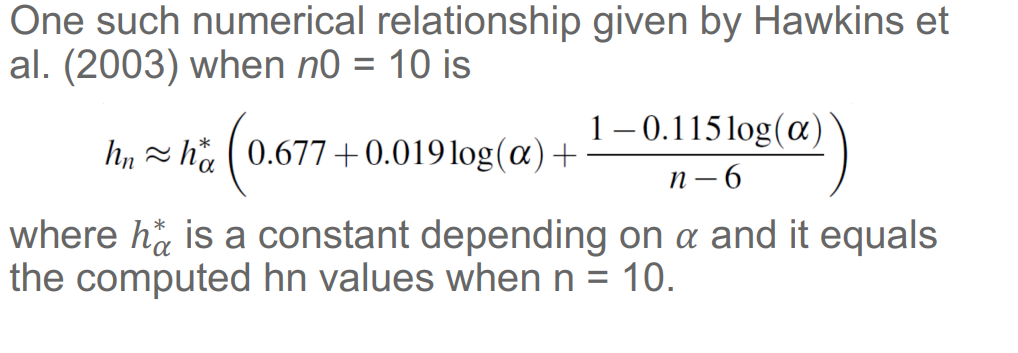
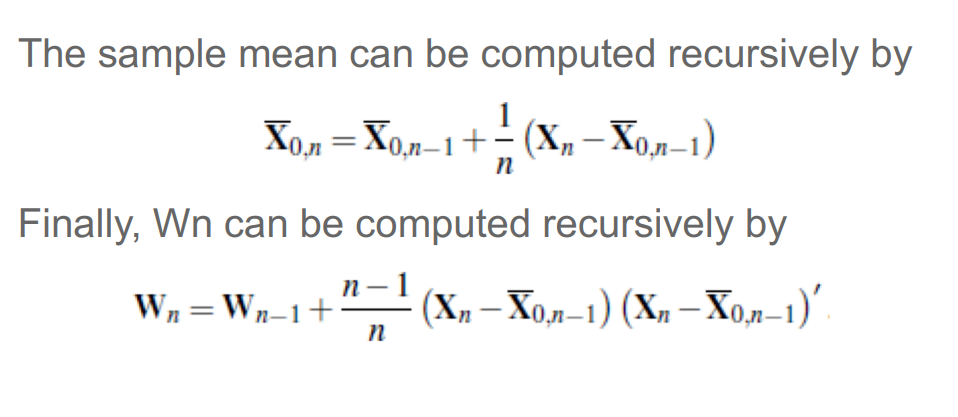
One such numerical relationship given by Hawkins et al. (2003) when n0=10 is hnh(0.677+0.019log()+n610.115log()) where h is a constant depending on and it equals the computed hn values when n=10. The sample mean can be computed recursively by X0,n=X0,n1+n1(XnX0,n1) Finally, Wn can be computed recursively by Wn=Wn1+nn1(XnX0,n1)(XnX0,n1)
Step by Step Solution
There are 3 Steps involved in it

Get step-by-step solutions from verified subject matter experts