

Question: Write an analysis about the following graph by selecting and reporting the main features. Write at least 150 words. D Number of drop outs
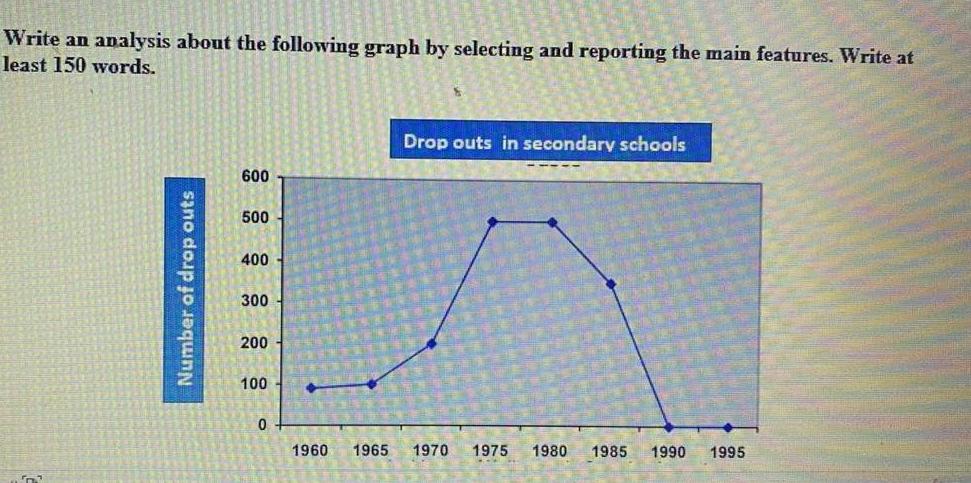
Write an analysis about the following graph by selecting and reporting the main features. Write at least 150 words. D Number of drop outs 600 500 400 300 200 100 0 1960 1965 Drop outs in secondary schools LES 1970 1975 1980 1985 1990 1995
Step by Step Solution
There are 3 Steps involved in it
1 Expert Approved Answer
Step: 1 Unlock

The graph shows the number of dropouts in secondary schools over time The data is from the United St... View full answer
Question Has Been Solved by an Expert!
Get step-by-step solutions from verified subject matter experts
Step: 2 Unlock
Step: 3 Unlock