

Question: write anaylsis for this 4 cash flows ratios result in comparsion of the two companies. and also please write wich company has a better cash
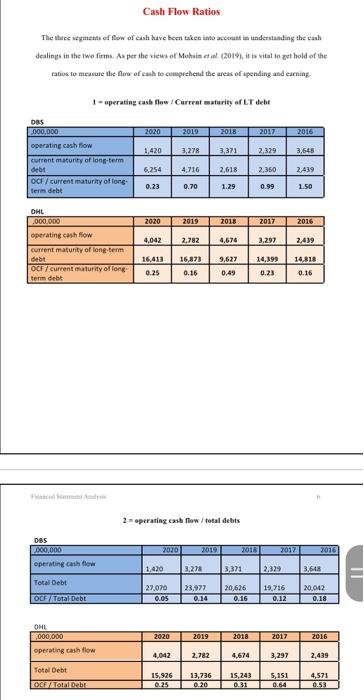
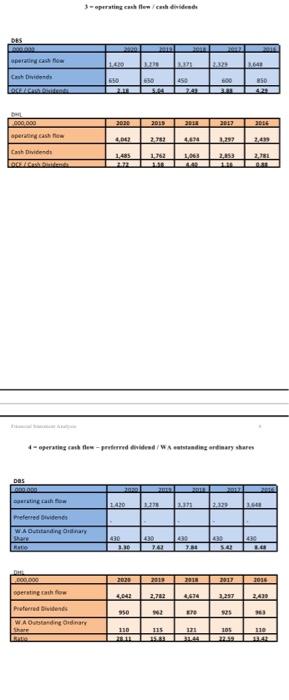
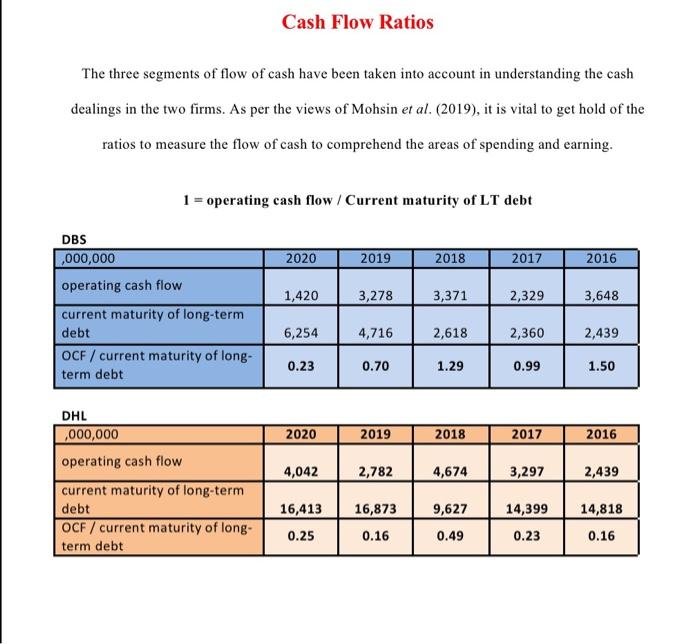
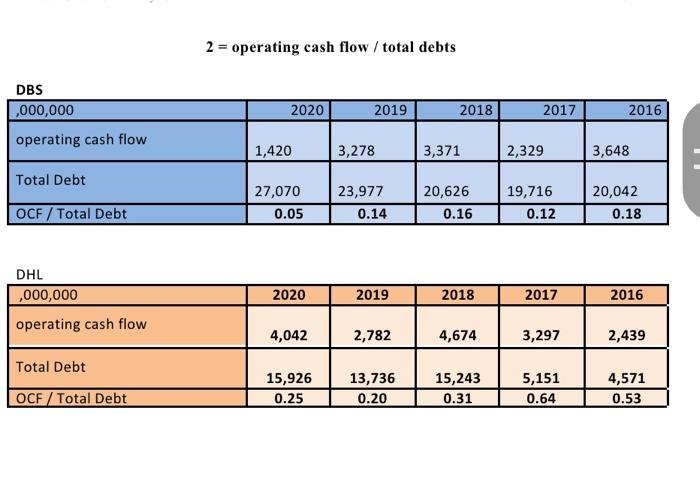
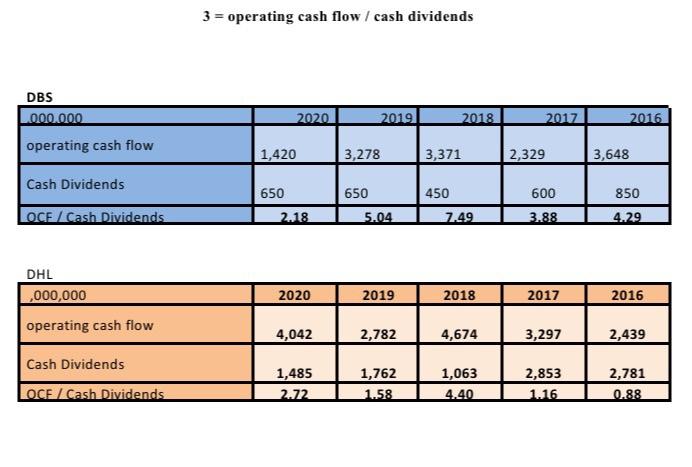
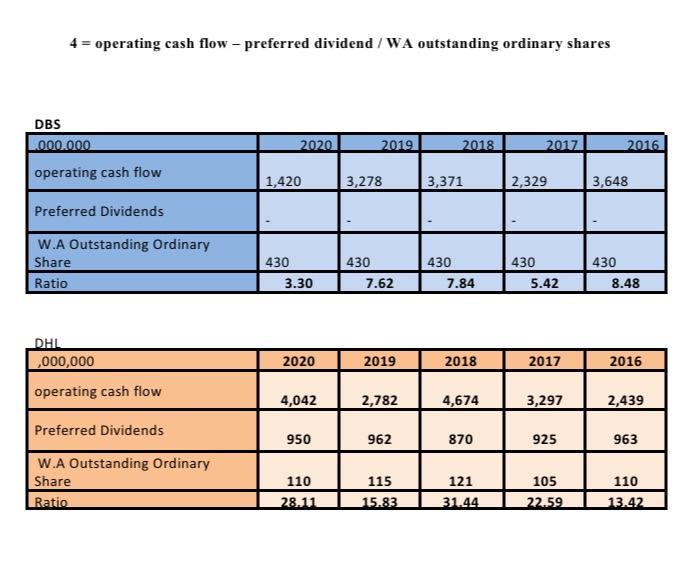
Cash Flow Ratios The themes of flow of cash luave been taken into account in understanding the cash dealings in the two firm. As per the views of Mohsin et al. (2019), it is vital to get hold of the ratios to measure the flow of cash to comprehend the areas of spending and earning 1 - operating cash flow / Current maturity of LT debt 2020 2019 2018 2017 2016 1,420 3,278 3,371 2,329 3,645 DBS 000,000 operating cash flow current maturity of long-term debt OCF / current naturity of long term debe 6,254 4,716 2,618 2,360 2.439 0.23 0.70 1.29 0.99 1.50 2020 2019 2018 2017 2016 4,042 2,782 4,674 3.297 DHL .000.000 operating cash flow current matunity of long-term debt OCF / current maturity of long term debet 2419 9.677 16.413 0.25 16,873 0.16 14,199 0.23 14.818 0.16 0.49 2 operating cash flow / total debts DBS 000,000 operating cash flow 2020 2019 2013 2012 2016 1.420 3.278 3371 2.129 3,648 Total Debt 27,070 0.05 23,977 0.14 20.626 0.16 19,716 0.12 20.042 0.18 OCF/Total Debt OHL 000,000 operating cash flow 2020 7019 2018 2017 2016 4,042 2,782 4,674 3,297 2,439 Total Debt 15,926 0.25 13,736 0.20 15,243 0.31 5,151 0.64 LORE/Total Dahl 4,571 0.53 .-preting at ilar ah niland 200 650 Cabrics ARRARO 450 100 650 STRE 850 42 000 DOO 2000 2015 2013 2017 2015 DET 2782 LEN 1,299 2,41 apering cash Cashiede 1485 12 1,00 2,053 2, 4-perating cash flow- pin/ Watstanding ordinary shares DOS BRO 140 2020 Preferredvidenes WADding Ordinary Late GO L. 7070 SA HE 2020 2012 2010 2011 2015 2.262 4618 1297 2.430 senting to Preferred WAOstanding onary 950 ERO 25 110 115 105 Cash Flow Ratios The three segments of flow of cash have been taken into account in understanding the cash dealings in the two firms. As per the views of Mohsin et al. (2019), it is vital to get hold of the ratios to measure the flow of cash to comprehend the areas of spending and earning. 1 = operating cash flow / Current maturity of LT debt 2020 2019 2018 2017 2016 1,420 3,278 3,371 2,329 3,648 DBS ,000,000 operating cash flow current maturity of long-term debt OCF / current maturity of long- term debt 6,254 4,716 2,618 2,360 2,439 0.23 0.70 1.29 0.99 1.50 2020 2019 2018 2017 2016 4,042 2,782 DHL ,000,000 operating cash flow current maturity of long-term debt OCF / current maturity of long- term debt 4,674 3,297 2,439 16,413 16,873 9,627 14,399 14,818 0.16 0.25 0.16 0.49 0.23 2 = operating cash flow / total debts DBS ,000,000 2020 2019 2018 2017 2016 operating cash flow 1,420 3,278 3,371 2,329 3,648 Total Debt 27,070 0.05 23,977 0.14 20,626 0.16 19,716 0.12 20,042 0.18 OCF/Total Debt DHL ,000,000 operating cash flow 2020 2019 2018 2017 2016 4,042 2,782 4,674 3,297 2,439 Total Debt OCF/Total Debt 15,926 0.25 13,736 0.20 15,243 0.31 5,151 0.64 4,571 0.53 3 = operating cash flow / cash dividends DBS 1.000.000 2020 2019 2018 2017 2016 operating cash flow 1,420 3,278 3,371 2,329 3,648 Cash Dividends 650 450 600 850 650 5.04 OCE / Cash Dividends 2.18 7.49 3.88 4.29 DHL ,000,000 operating cash flow 2020 2019 2018 2017 2016 4,042 2,782 4,674 3,297 2,439 Cash Dividends 1,485 2.72 1,762 1.58 1,063 4.40 2,853 1.16 2,781 0.88 OCF / Cash Dividends 4 = operating cash flow - preferred dividend / WA outstanding ordinary shares DBS 1.000.000 2020 2019 2018 2017 2016 operating cash flow 1,420 3,278 3,371 2,329 3,648 Preferred Dividends W.A Outstanding Ordinary Share Ratio 430 3.30 430 7.62 430 7.84 430 5.42 430 8.48 DHL ,000,000 2020 2019 2018 2017 2016 operating cash flow 4,042 2,782 4,674 3,297 2,439 Preferred Dividends 950 962 870 925 963 W.A Outstanding Ordinary Share Ratio 115 110 28.11 121 31.44 105 22.59 110 13.42 15.83
Step by Step Solution
There are 3 Steps involved in it

Get step-by-step solutions from verified subject matter experts