

Question: Write data Analysis on this picture. Section 3: Data Analysis [10 points) The graph below depicts the average consumer expenditures in US Dollars) by people
Write data Analysis on this picture.
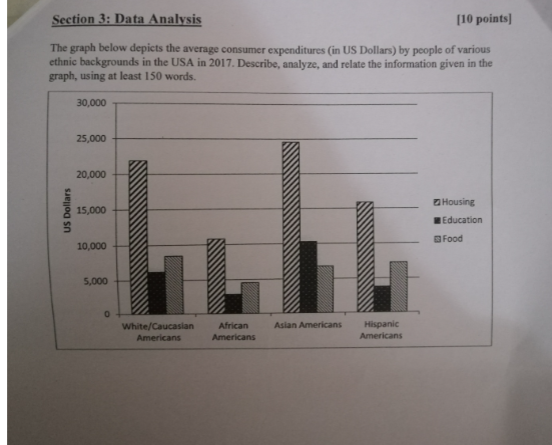
Section 3: Data Analysis [10 points) The graph below depicts the average consumer expenditures in US Dollars) by people of various ethnic backgrounds in the USA in 2017. Describe, analyze, and relate the information given in the graph, using at least 150 words. 30,000 25,000 20,000 US Dollars 15,000 Housing Education Food 10,000 5,000 | 0 Asian Americans White/Caucasian Americans African Americans Hispanic Americans
Step by Step Solution
There are 3 Steps involved in it
1 Expert Approved Answer
Step: 1 Unlock

Question Has Been Solved by an Expert!
Get step-by-step solutions from verified subject matter experts
Step: 2 Unlock
Step: 3 Unlock