

Question: Write down the known partial DNA sequence for the wild-type beta-globin gene as seen below. This sequence represents the portion of the beta-globin gene that
Write down the known partial DNA sequence for the wild-type beta-globin gene as seen below. This sequence represents the portion of the beta-globin gene that has been amplified using PCR. Typically, amplified sequences will be longer than this example, and some restriction enzymes need longer sequences to function. However, for ease in this activity, the sequences are short. Wild-type: 5' CTG ACT CCT GAG 3' 3' GAC TGA GGA CTC 5'
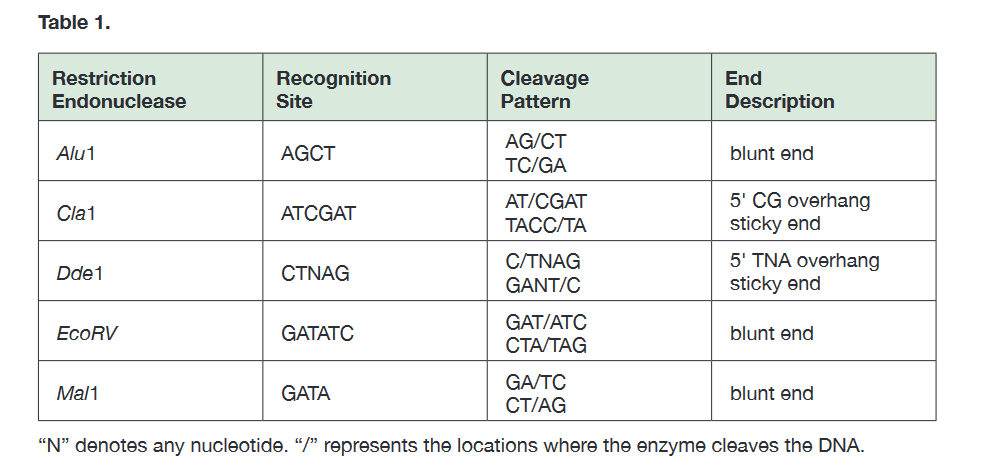
2. Beside the wild-type sequence, write the DNA sequence for the known mutation associated with sickle cell anemia. Homozygous mutant: 5' CTG ACT CCT GTG 3' 3' GAC TGA GGA CAC 5' 3. Determine the recognition site and cleavage pattern of Dde1 by referring to the restriction enzyme table provided in the background section (see Table 1). Remember that the "N" notation represents any of the four nucleotides
Using the information in Table 1, find the recognition site for Dde1 in your written DNA sequences. Draw a circle around the Dde1 recognition site(s) in your DNA sequence, and draw a bold line where Dde1 would cleave. Remember, Dde1 will only cut where there is an exact match in sequence.
* look at table 1 attached
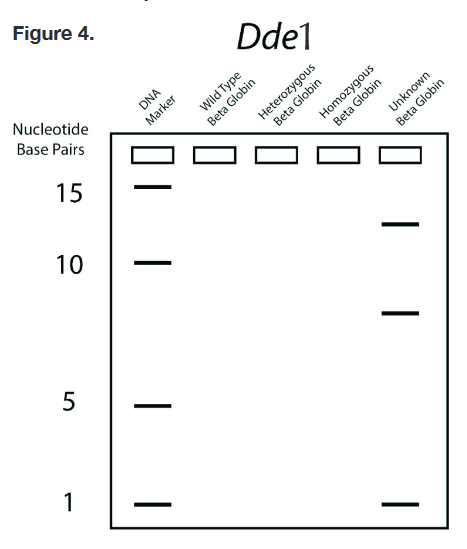
- 5. In this step, you will draw bands on the gel diagram in Figure 4 representing DNA samples from individuals with different sets of beta-globin alleles. a. Begin by counting the number of DNA fragments that were produced by treatment with Dde1 for the wild-type and homozygous mutant samples. The number of fragments after Dde1 treatment tells you the number of bands you will draw for each sample. Recalling that a heterozygote will have one of each allele, determine the number of bands that will be present in the heterozygous sample. b. Count the number of base pairs for each fragment. Compare your counts to the size of the DNA markers shown on the far-left side of the gel diagram. The size of each DNA fragment, expressed in nucleotide base pairs, determines its position in the gel at the end of electrophoresis. Draw the bands for each sample: wild-type, heterozygous mutant, and homozygous mutant. c. Compare the band patterns drawn on the gel diagram to the sample DNA fragment from the baby, on the far-right side of the gel. This will enable you to determine the baby's genotype. look at figure 4
Step by Step Solution
There are 3 Steps involved in it

Get step-by-step solutions from verified subject matter experts