

Question: Write down the step in spss for line graph (Simple and Multiple). For which type of data we make line graph. b) How we
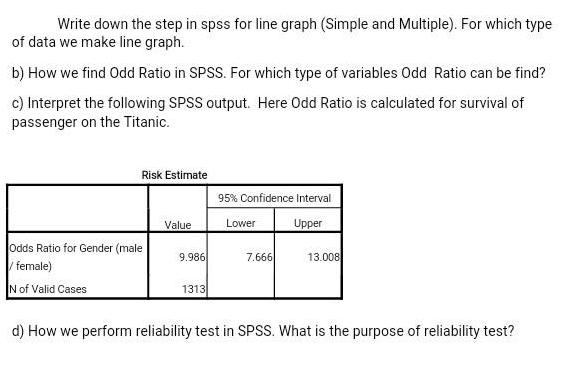
Write down the step in spss for line graph (Simple and Multiple). For which type of data we make line graph. b) How we find Odd Ratio in SPSS. For which type of variables Odd Ratio can be find? c) Interpret the following SPSS output. Here Odd Ratio is calculated for survival of passenger on the Titanic. Risk Estimate Odds Ratio for Gender (male female) N of Valid Cases Value 9.986 1313 95% Confidence Interval Upper Lower 7.666 13.008 d) How we perform reliability test in SPSS. What is the purpose of reliability test?
Step by Step Solution
There are 3 Steps involved in it
A Step 1 Determine the variables Step 2 Establish the range of the variable Step 3 Establish the graphs scale Step 4 Title the graph number each axis ... View full answer

Get step-by-step solutions from verified subject matter experts