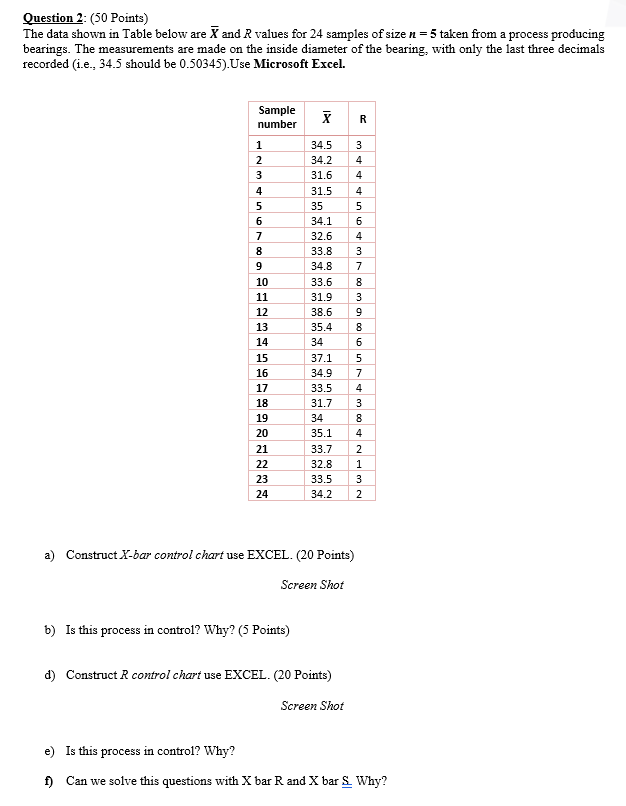
Question: write excel steps and screenshot the output Question 2: (50 Points) The data shown in Table below are 7 and R values for 24 samples

write excel steps and screenshot the output

write excel steps and screenshot the output

Question 2: (50 Points) The data shown in Table below are 7 and R values for 24 samples of size n = 5 taken from a process producing bearings. The measurements are made on the inside diameter of the bearing, with only the last three decimals recorded (i.e., 34.5 should be 0.50345). Use Microsoft Excel. R Sample number 1 2 3 4 5 6 7 8 9 10 11 12 13 14 15 16 17 18 19 20 21 22 23 24 34.5 34.2 31.6 31.5 35 34.1 32.6 33.8 34.8 33.6 31.9 38.6 35.4 34 37.1 34.9 33.5 31.7 34 35.1 33.7 32.8 33.5 34.2 m+ + + + N 00 00 N 00 Nm 3 9 8 6 5 4 3 8 4 a) Construct X-bar control chart use EXCEL. (20 Points) Screen Shot b) Is this process in control? Why? (5 Points) d) Construct R control chart use EXCEL. (20 Points) Screen Shot e) Is this process in control? Why? f) Can we solve this questions with X bar R and X bar S Why

Step by Step Solution

There are 3 Steps involved in it

1 Expert Approved Answer
Step: 1 Unlock blur-text-image
Question Has Been Solved by an Expert!

Get step-by-step solutions from verified subject matter experts

Step: 2 Unlock
Step: 3 Unlock

Students Have Also Explored These Related General Management Questions!