

Question: write in jupyter python reference page below Create a quarterly turnover report for two companies: Apple and Google in 2019. For each company, randomly generate
write in jupyter python

reference page below
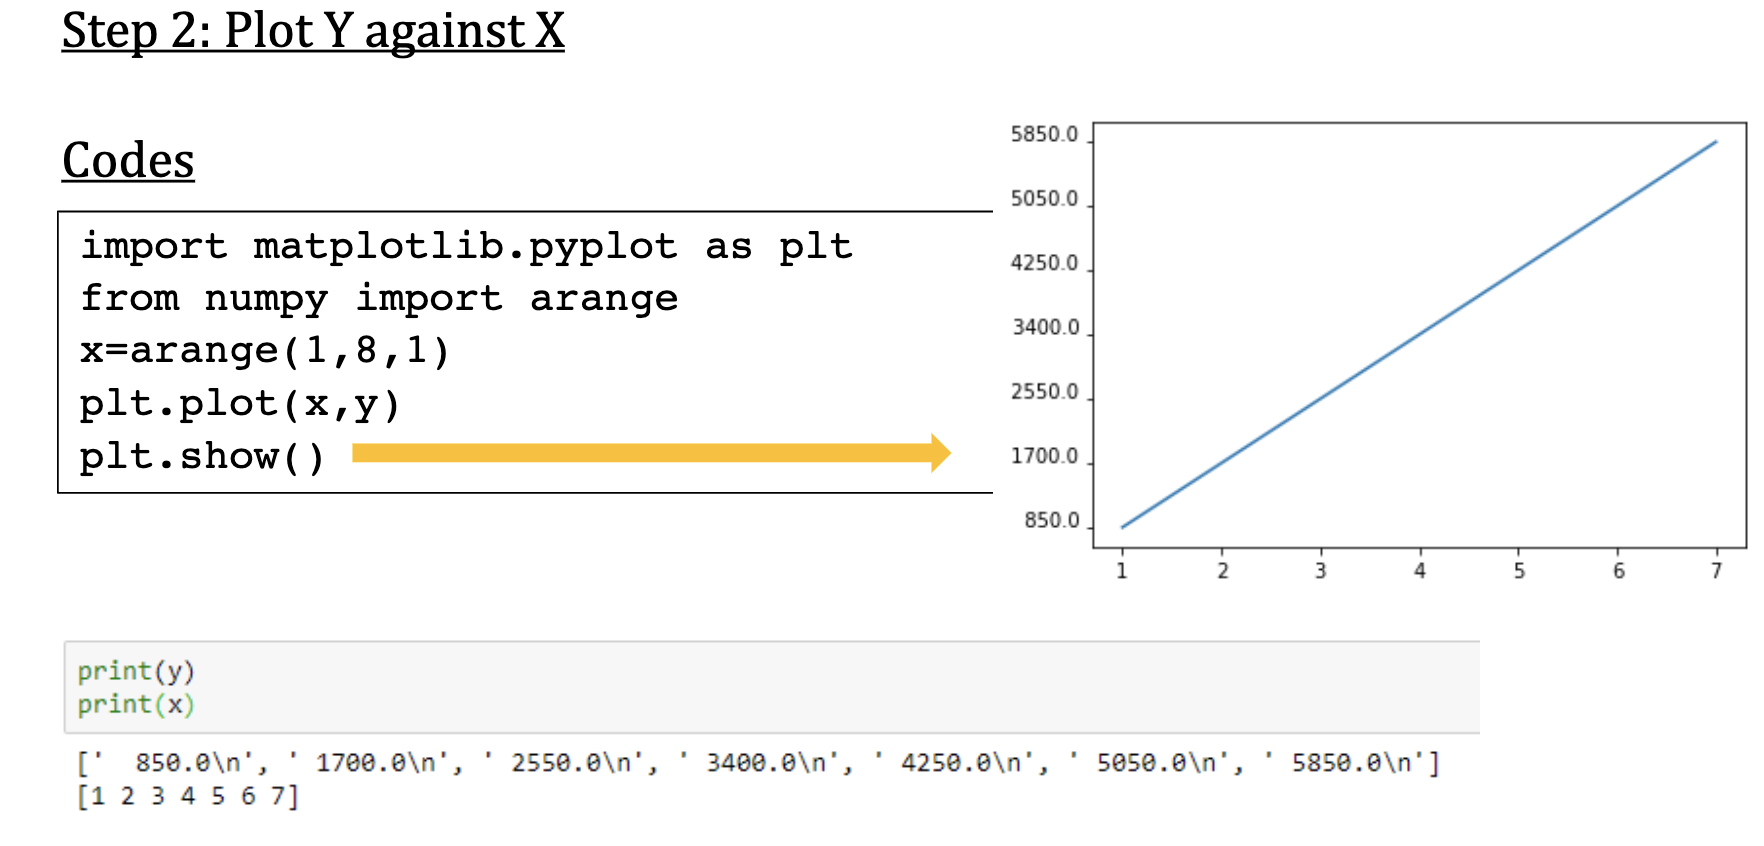
Create a quarterly turnover report for two companies: Apple and Google in 2019. For each company, randomly generate a value between 3 and 4 (unit: ten billion) as turnover for each of the four quarters. Make one line plot figure: show two lines in one figure, x-axis shows dates, y-axis shows turnover, data points of the two companies should be marked in different colors and markers. Refer to Unit 2 page 20 lecture notes. Hint: numpy.random.uniform(), pandas.date_range () Step 2: Plot Y against X 5850.0 Codes 5050.0 4250.0 3400.0 import matplotlib.pyplot as plt from numpy import arange x=arange(1,8,1) plt.plot(x,y) plt.show(). 2550.0 1700.0 850.0 2 print(y) print(x) [' 850.0 ', '1700.0 ', '2550.0 ', '3400.0 ', '4250.0 ', '5050.0 ', '5850.0 '] [1 2 3 4 5 6 7]
Step by Step Solution
There are 3 Steps involved in it

Get step-by-step solutions from verified subject matter experts