

Question: Write in Python import core libraries import matplotlib.pyplot as plt import seaborn as sns import pandas as pd import numpy as np This time we
Write in Python
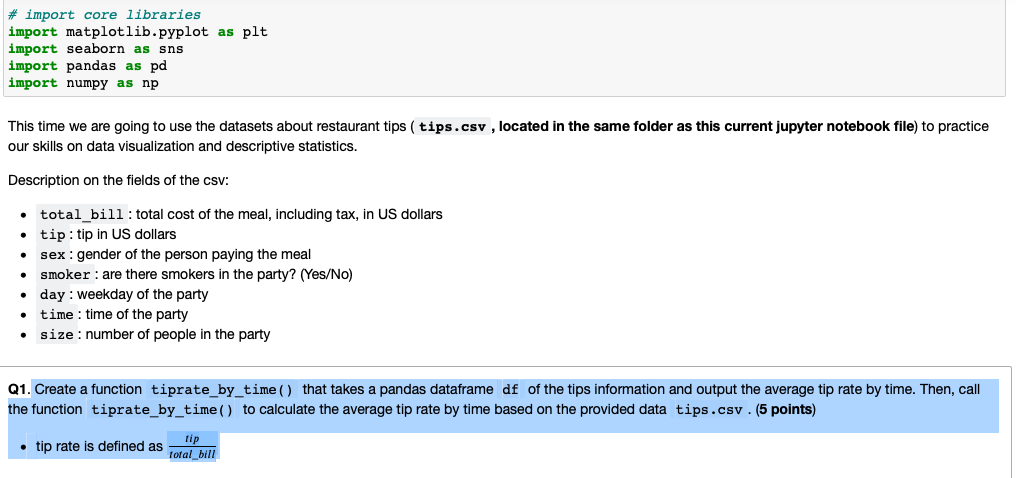
import core libraries import matplotlib.pyplot as plt import seaborn as sns import pandas as pd import numpy as np This time we are going to use the datasets about restaurant tips ( tips.csv , located in the same folder as this current jupyter notebook file) to practice our skills on data visualization and descriptive statistics. Description on the fields of the csv: . total_bill: total cost of the meal, including tax, in US dollars tip: tip in US dollars sex: gender of the person paying the meal smoker: are there smokers in the party? (Yes/No) day: weekday of the party . time : time of the party size : number of people in the party Q1. Create a function tiprate_by_time() that takes a pandas dataframe df of the tips information and output the average tip rate by time. Then, call the function tiprate_by_time() to calculate the average tip rate by time based on the provided data tips.csv . (5 points) tip rate is defined as tip Total_bill
Step by Step Solution
There are 3 Steps involved in it

Get step-by-step solutions from verified subject matter experts