

Question: Write in Python In [ ]: import core libraries import matplotlib.pyplot as plt import seaborn as sns import pandas as pd import numpy as np
Write in Python
![Write in Python In [ ]: import core libraries import matplotlib.pyplot as](https://dsd5zvtm8ll6.cloudfront.net/si.experts.images/questions/2024/09/66f5281942e07_61666f52818db01b.jpg)
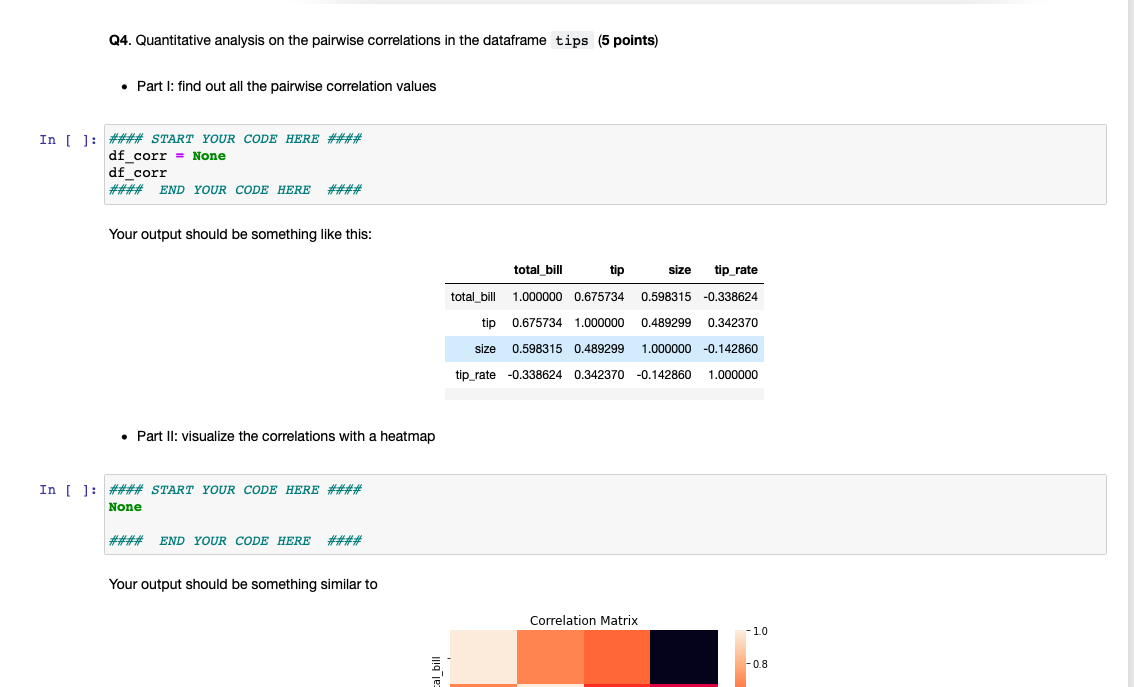
In [ ]: import core libraries import matplotlib.pyplot as plt import seaborn as sns import pandas as pd import numpy as np This time we are going to use the datasets about restaurant tips (tips.csv , located in the same folder as this current jupyter notebook file) to practice our skills on data visualization and descriptive statistics. Description on the fields of the csv: . total_bill: total cost of the meal, including tax, in US dollars tip: tip in US dollars sex: gender of the person paying the meal smoker: are there smokers in the party? (Yes/No) day: weekday of the party time : time of the party size: number of people in the party . Q4. Quantitative analysis on the pairwise correlations in the dataframe tips (5 points) Part I: find out all the pairwise correlation values In [ ]: **** START YOUR CODE HERE #### df_corr = None df corr END YOUR CODE HERE Your output should be something like this: total bill tip size tip rate total bill 1.000000 0.675734 0.598315 -0.338624 tip 0.675734 1.000000 0.489299 0.342370 size 0.598315 0.489299 1.000000 -0.142860 tip_rate -0.338624 0.342370 -0.142860 1.000000 Part II: visualize the correlations with a heatmap In [ ]: **** START YOUR CODE HERE #### None END YOUR CODE HERE Your output should be something similar to Correlation Matrix - 1.0 -0.8 cal_bill
Step by Step Solution
There are 3 Steps involved in it

Get step-by-step solutions from verified subject matter experts