

Question: WRITE MATLAB CODE 8.1 The following figure shows the graph of the two functions g and h (as defined in the legend). Use function handles
WRITE MATLAB CODE
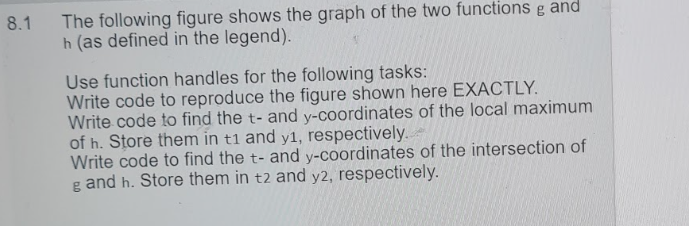
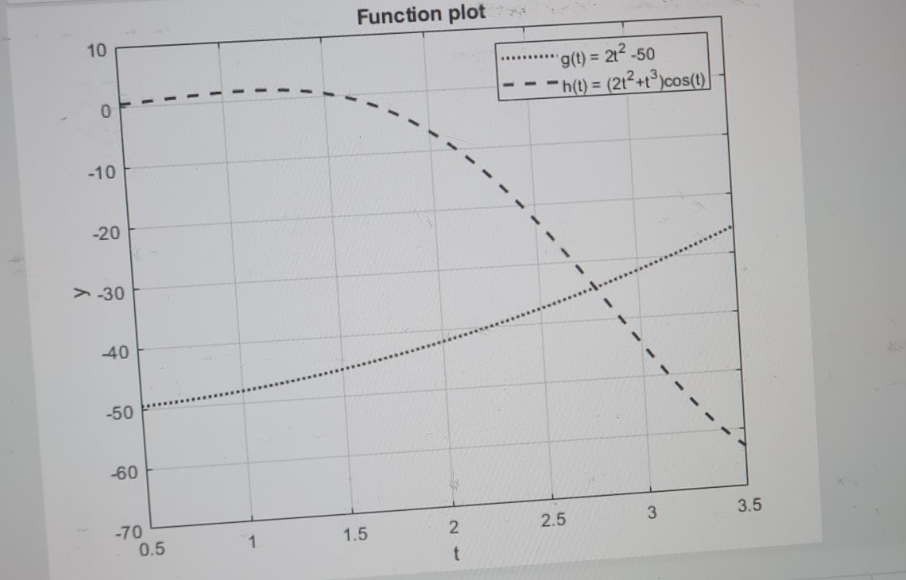
8.1 The following figure shows the graph of the two functions g and h (as defined in the legend). Use function handles for the following tasks: Write code to reproduce the figure shown here EXACTLY. Write code to find the t- and y-coordinates of the local maximum of h. Store them in ti and y1, respectively. Write code to find the t- and y-coordinates of the intersection of and h. Store them in t2 and y2, respectively. Function plot 10 : 21.50 'g(t) = - h(t) = (212+t)cos(t) - 0 -10 -20 >-30 40 -50 -60 3 3.5 -70 2.5 1.5 2. 1 0.5 t
Step by Step Solution
There are 3 Steps involved in it
1 Expert Approved Answer
Step: 1 Unlock

Question Has Been Solved by an Expert!
Get step-by-step solutions from verified subject matter experts
Step: 2 Unlock
Step: 3 Unlock