

Question: Write MATLAB code to visualize a 3D scatter plot based on provided data. The data consists of three arrays: population density, average_income, and education_level,

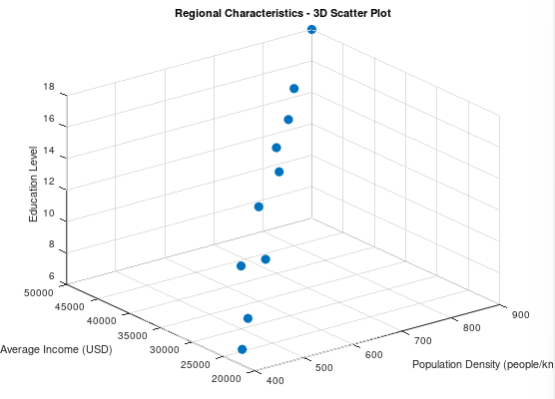
Write MATLAB code to visualize a 3D scatter plot based on provided data. The data consists of three arrays: population density, average_income, and education_level, representing characteristics of different regions. population density = [500, 800, 450, 700, 600, 750, 900, 400, 550, 680] average_income = [30000, 45000, 25000, 40000, 35000, 42000, 50000, 22000, 30000, 38000] education_level = [10, 16, 8, 14, 12, 15, 18, 7, 10, 13] Use these arrays to create a 3D scatter plot, where each point represents a region, and label the axes accordingly. Education Level 18 16 14 12 10 00 6 50000 45000 40000 Average Income (USD) 35000 Regional Characteristics - 3D Scatter Plot 30000 25000 20000 400 500 600 700 800 900 Population Density (people/kn
Step by Step Solution
There are 3 Steps involved in it

Get step-by-step solutions from verified subject matter experts