

Question: Write Matlab codes and plot the the graph 1. Reproduce the graph of the signal shown below in MATLAB. (Hint: command t> 0 will return
 Write Matlab codes and plot the the graph
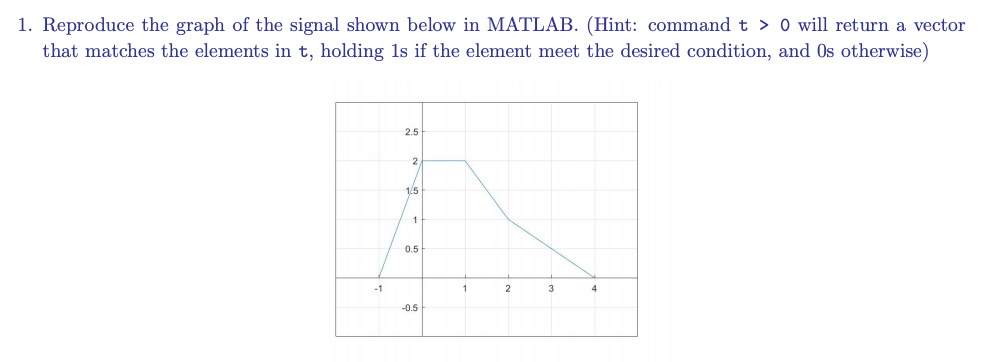
1. Reproduce the graph of the signal shown below in MATLAB. (Hint: command t> 0 will return a vector that matches the elements in t, holding ls if the element meet the desired condition, and Os otherwise) 2.5 0.5 0.5
Step by Step Solution
There are 3 Steps involved in it
1 Expert Approved Answer
Step: 1 Unlock

Question Has Been Solved by an Expert!
Get step-by-step solutions from verified subject matter experts
Step: 2 Unlock
Step: 3 Unlock