

Question: Write Matlab or Mathematica code to reproduce the plots below. Obviously your random points will be different, but you should show that the mean-squared-displacement looks
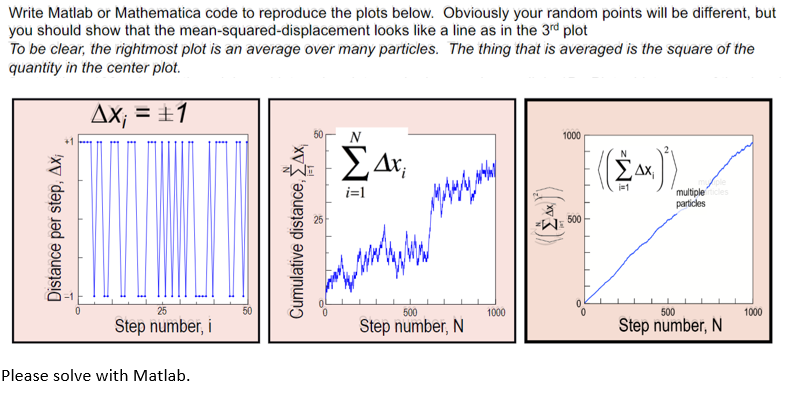
Write Matlab or Mathematica code to reproduce the plots below. Obviously your random points will be different, but you should show that the mean-squared-displacement looks like a line as in the 3rd plot To be clear, the rightmost plot is an average over many particles. The thing that is averaged is the square of the quantity in the center plot. AX; = +1 multiple ces particles Distance per step, AX; Cumulative distance 0 1000 500 1000 Step number, i 500 Step number. N Step number. N o Please solve with Matlab
Step by Step Solution
There are 3 Steps involved in it
1 Expert Approved Answer
Step: 1 Unlock

Question Has Been Solved by an Expert!
Get step-by-step solutions from verified subject matter experts
Step: 2 Unlock
Step: 3 Unlock