

Question: Write matlab program for y1, y2, y3, y4 to display this output graph yi, y2, y3, and y4 are defined as follows: xcos (x) X+2
Write matlab program for y1, y2, y3, y4 to display this output graph 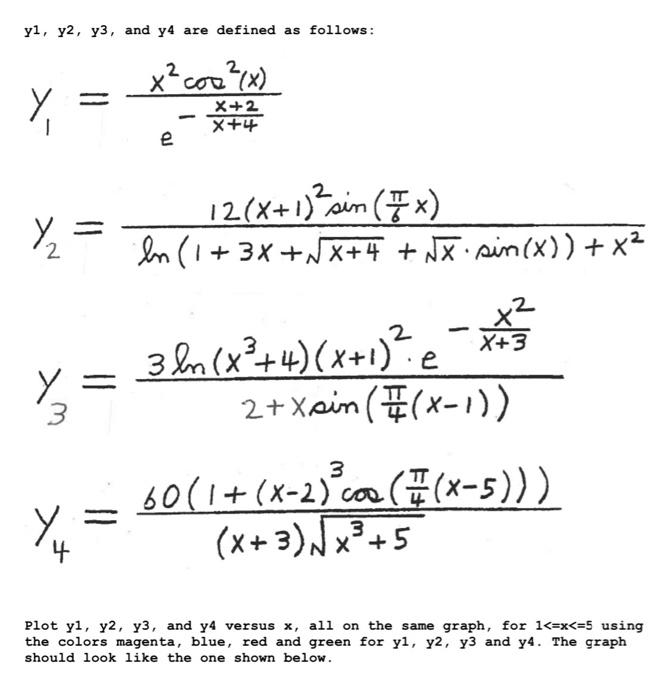
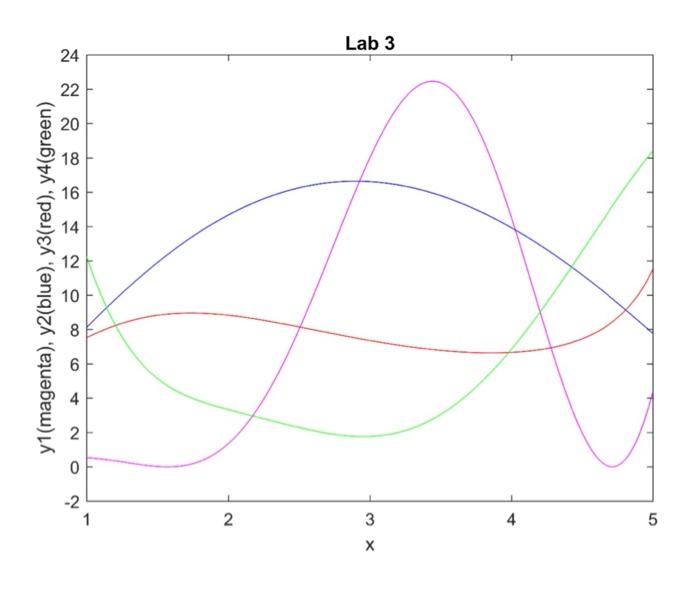
yi, y2, y3, and y4 are defined as follows: xcos (x) X+2 X+4 e Y 12(x+1)3sin (1 x) In (1 + 3x +NX+4 + NX.sin(x)) + x2 X+3 3h(x2+4)(x+1)?? - Y = = 2+ Xein ((x-1)) 3 3 Y4 6011+(x-2).com ((x-5))) (x+3)x+ 5 Plot yi, y2, y3, and y4 versus x, all on the same graph, for 1
Step by Step Solution
There are 3 Steps involved in it
1 Expert Approved Answer
Step: 1 Unlock

Question Has Been Solved by an Expert!
Get step-by-step solutions from verified subject matter experts
Step: 2 Unlock
Step: 3 Unlock