

Question: Write R code that will create the Bayesian network shown below. Include your code and output (e.g., a screenshot of a plot) that shows the
Write R code that will create the Bayesian network shown below. Include your code and output (e.g., a screenshot of a plot) that shows the Bayesian network graph and the contents of each nodes probability table. Then write R code that uses the Bayesian network to predict Quality for the following 2 instances: (i) Location = Good, Quality = Normal, Cost = High, No. of People = Low, and (ii) Location = Bad, Quality = Good, Cost = Low, No. of People = High; include output (e.g., a screenshot) that shows the results of those predictions as a confusion matrix.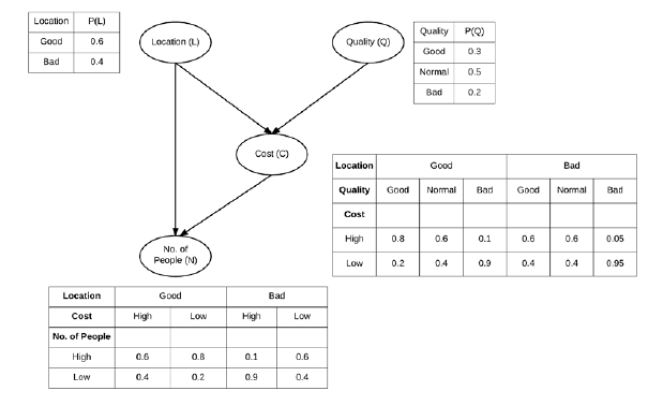
LocationPIL) 0.6 0.4 Qualy PO) Good 03 Normal05 Bad 0.2 Good Location (L) Qualty ( Cost (C) Good Bad QualityGoodNomal Bad Good Nomal Ba Cost High 08 0.1 0.6 005 No. of People (N) 0.2 04 0.9 0.4 0.4 005 Good Cost No. of People 0.8 0.6 0.9 0.4
Step by Step Solution
There are 3 Steps involved in it

Get step-by-step solutions from verified subject matter experts