

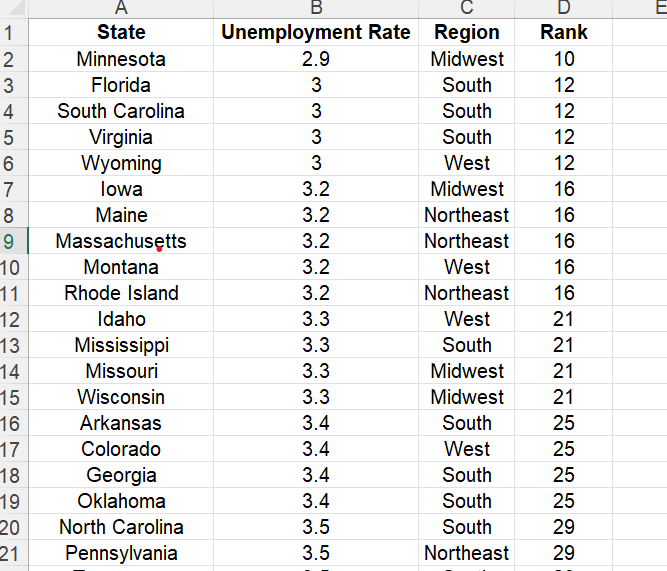
Question: Write rstudio codes to create a map chart by plotting Unemployment Rate of each State into USA map. Make sure to have appropriate coloring.
Write rstudio codes to create a map chart by plotting "Unemployment Rate" of each "State" into USA map. Make sure to have appropriate coloring.
Step by Step Solution
There are 3 Steps involved in it
1 Expert Approved Answer
Step: 1 Unlock

Question Has Been Solved by an Expert!
Get step-by-step solutions from verified subject matter experts
Step: 2 Unlock
Step: 3 Unlock