

Question: Write the binomial probability and the normal probability for the shaded region of the graph. Find the value of each probability and compare the
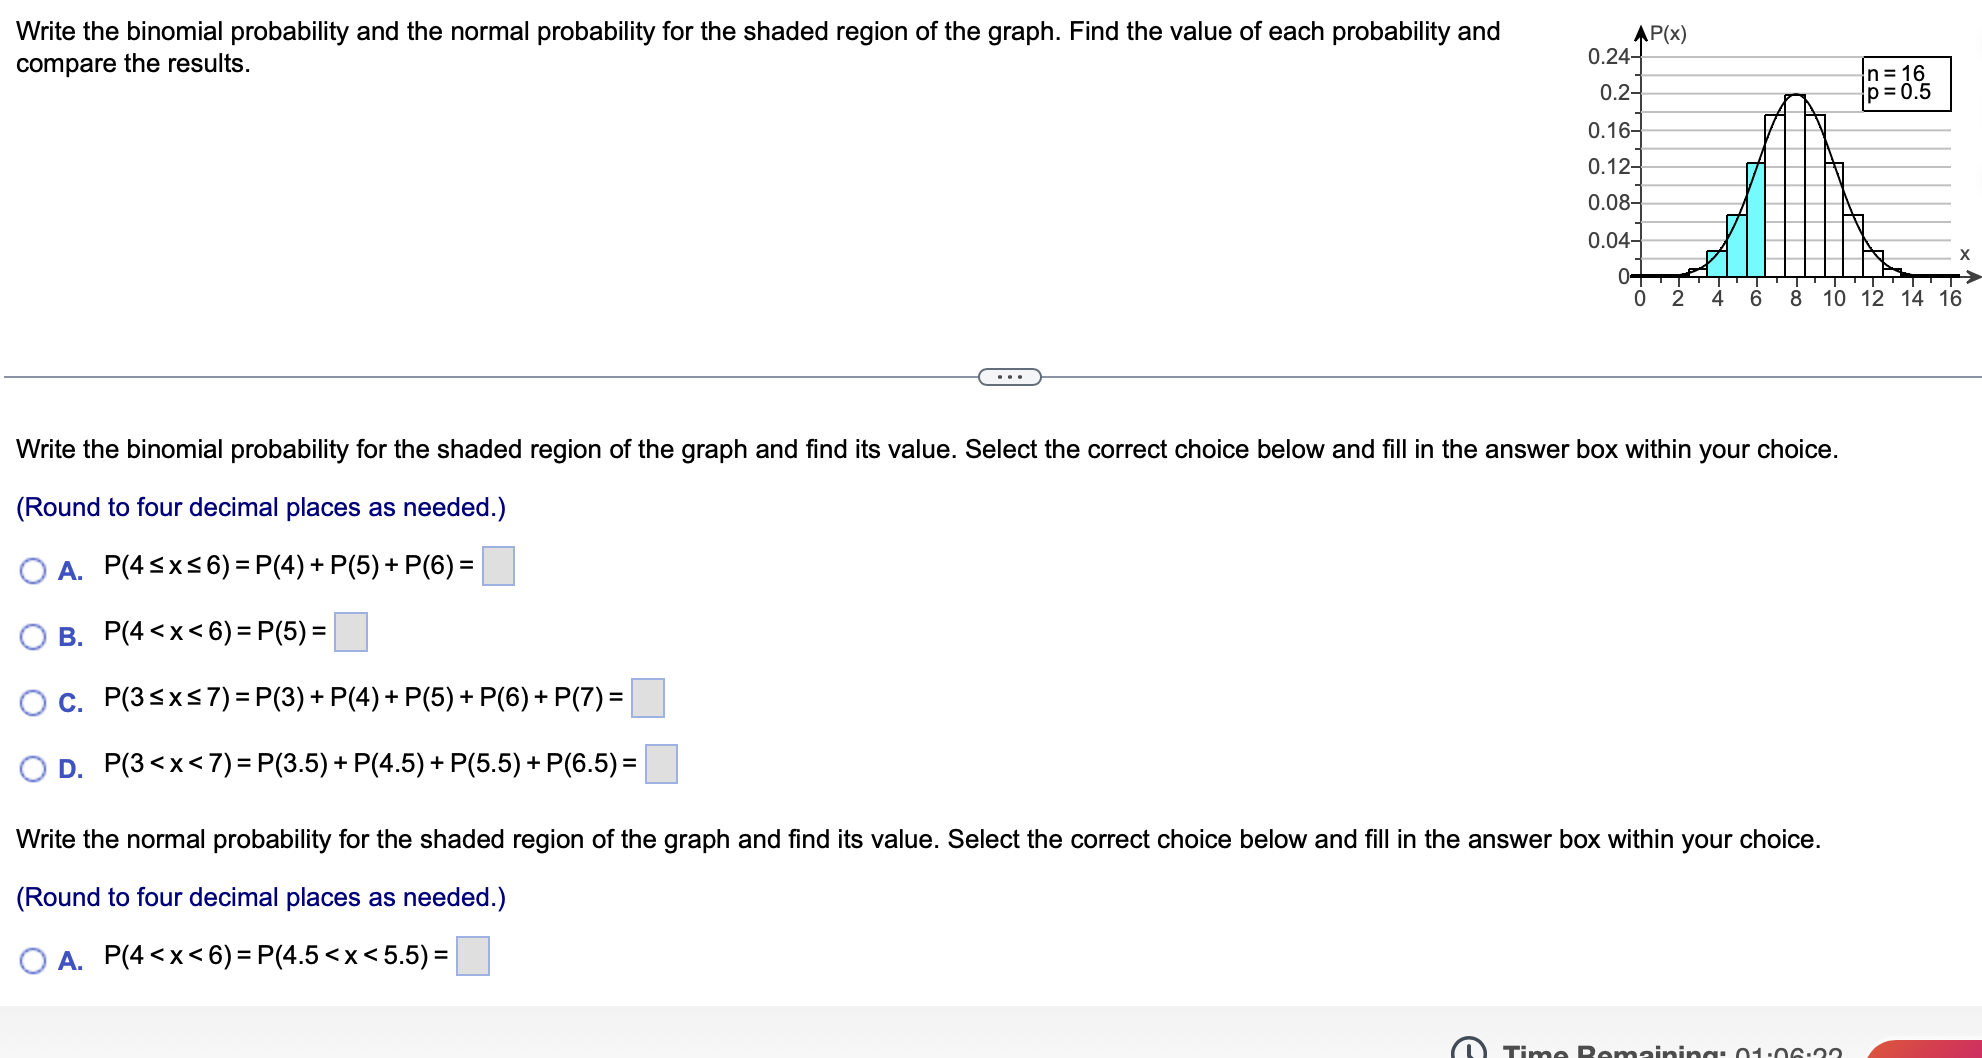
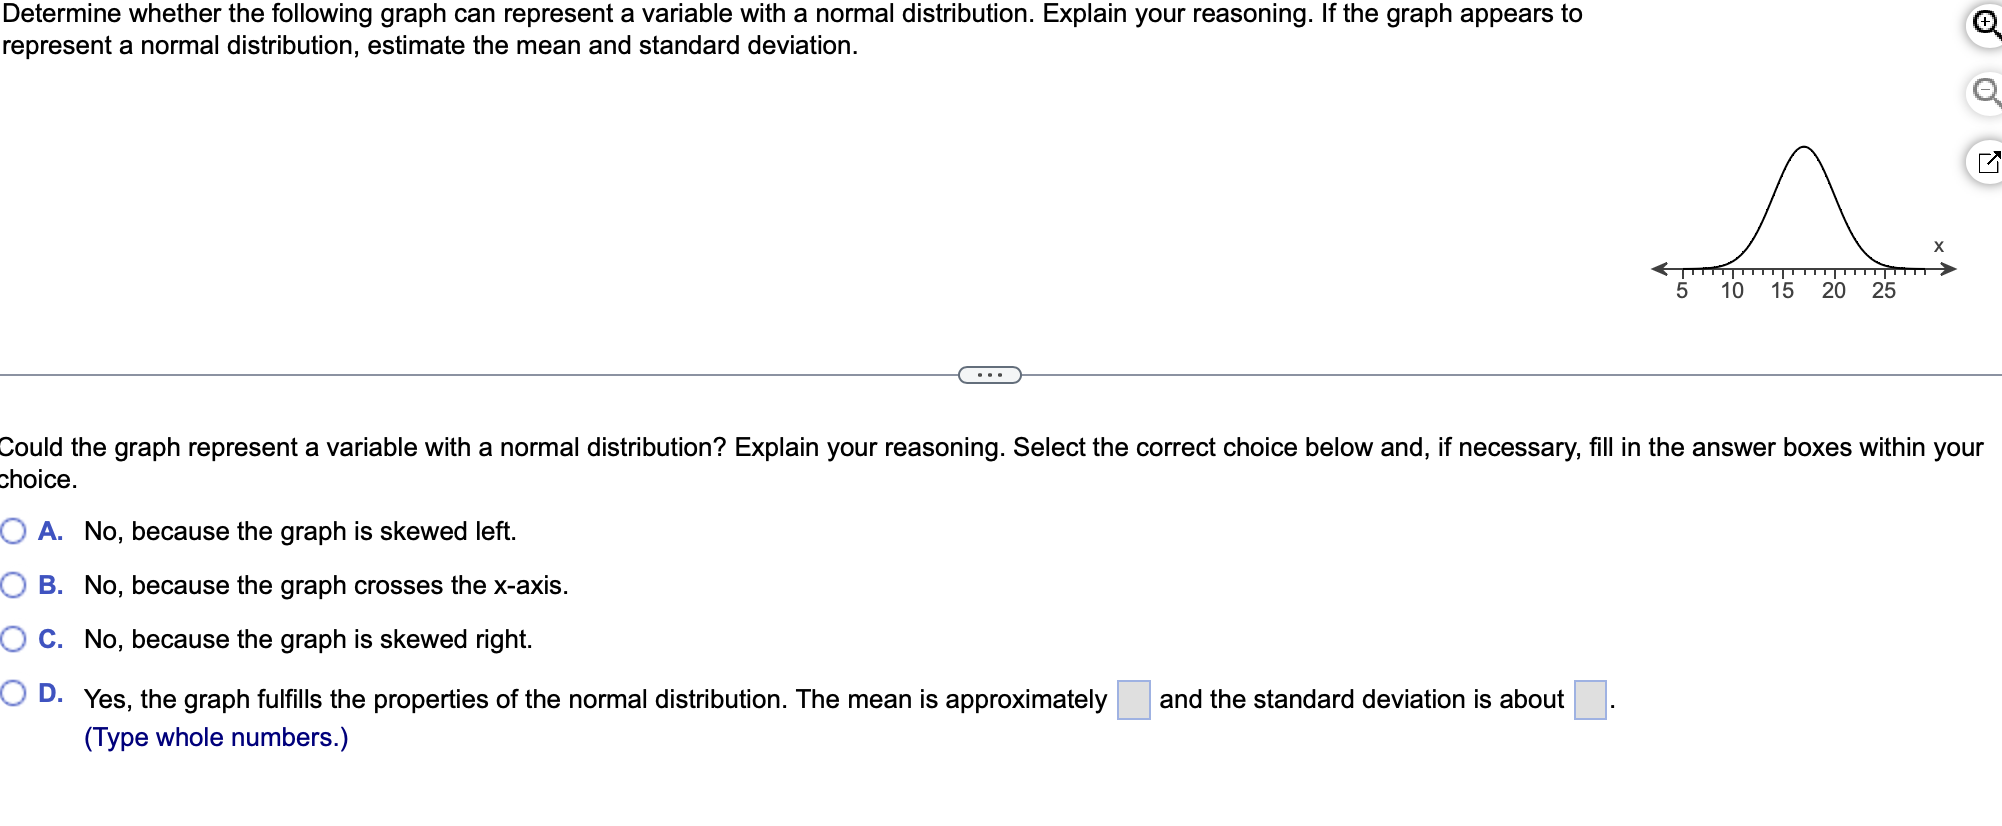
Write the binomial probability and the normal probability for the shaded region of the graph. Find the value of each probability and compare the results. AP(X) 0.24- 0.2- n=16 p=0.5 0.16- 0.12- 0.08- 0.04- 0- -co 0 2 4 6 8 10 12 14 16 Write the binomial probability for the shaded region of the graph and find its value. Select the correct choice below and fill in the answer box within your choice. (Round to four decimal places as needed.) A. P(4x6) = P(4) + P(5) + P(6)= B. P(4 Determine whether the following graph can represent a variable with a normal distribution. Explain your reasoning. If the graph appears to represent a normal distribution, estimate the mean and standard deviation. 5 10 15 20 25 X + Q Could the graph represent a variable with a normal distribution? Explain your reasoning. Select the correct choice below and, if necessary, fill in the answer boxes within your choice. A. No, because the graph is skewed left. B. No, because the graph crosses the x-axis. C. No, because the graph is skewed right. D. Yes, the graph fulfills the properties of the normal distribution. The mean is approximately and the standard deviation is about (Type whole numbers.)
Step by Step Solution
There are 3 Steps involved in it

Get step-by-step solutions from verified subject matter experts