

Question: write the discussion and conclusion please Result Table 1: Centrifugal pump experimental results Ru RPM Padm Pdise SN barbar (mm) Cum Torque (Nm) HT (0
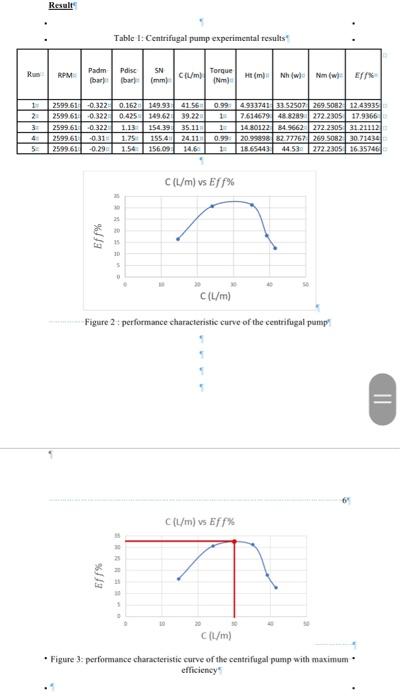
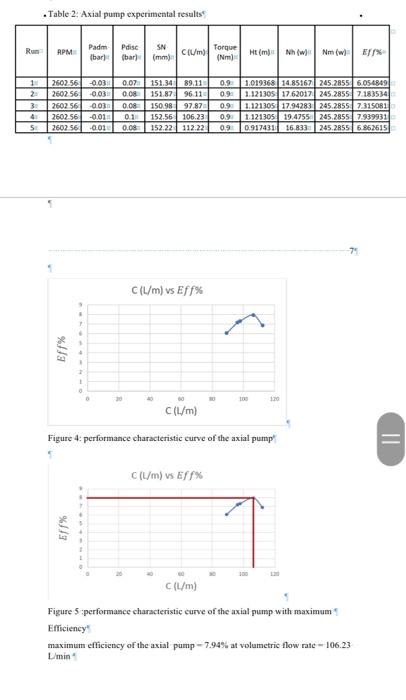
Result Table 1: Centrifugal pump experimental results Ru RPM Padm Pdise SN barbar (mm) Cum Torque (Nm) HT (0 | Nhn w1 Nimw 1 3 4 5 2599.61 -0.322 0.162 149.93 41.56 2599.61 -0.322 0425149.62 39.22 2599.61 -0.322 1.13 15439 35.11 2599 61 -0.31 1.75 155.4 24.11 2599.61 -0.291.54 156.09 14.6 0.994.933741 3352507 269.5082 12.43935 7.61467948.8289 272.2005 17.9366 1 14 80122 84.9662272.2305 31.21112 0.99 20.99898 82 77767 269 5082 30.71436 18.65443 44.53 272.2305 36.35746 C (l/m) vs Ef% 25 Ef% 20 15 10 5 C(L/m) Figure 2 - performance characteristic curve of the centrifugal pump" II CL/m) vs Eff% CL/m) . Figure 3: performance characteristic curve of the centrifugal pump with maximum efficiency Table 2: Axial pump experimental results Ru RPM Padm bar) Pdisc SN (bar) (mm) Cm) Torque (Nm) Ht (m Nh Nm (W) Ef 1 2 2602-56 2602 56 2607 56 2607 56 2602 56 3. 4 5 0.9 09 09 0.07 151.34 89.11 0.08 151.87 9611 0.08 150 98 97,87 0.1 152.56 106.23 0.08 152.22 112.22 -0.03 -003 -0.011 -001 1.019368 14.85167 245.28556.054849 1.121305 1762017 245.2855 7.183534 1.121305 17.94283 245.2855 7 315081 112130519.4755 245.2855 7939931 0.917431 16.833 245.2855 6.862615 09 09 74 CL/m) vs Eff% Eff% 0 120 C(L/m) Figure 4: performance characteristic curve of the axial pump = CL/m) vs Eff Eff% C(l/m) Figure 5 performance characteristic curve of the axial pump with maximum Efficiency maximum efficiency of the axial pump - 7.94% at volumetric flow rate-106.23 Limin Discussion . Did the performance characteristic curve confirm with theoretical curves found in literature? Explain Write one advantage and one disadvantage of each pump. Discuss the calculations and the % error. What are the causes of low pump efficiency
Step by Step Solution
There are 3 Steps involved in it

Get step-by-step solutions from verified subject matter experts