

Question: Write the MATLAB code to create a graph of y1=2x2 and y2=2xex for values of x from 0 to 1.5 seconds. The two curves should
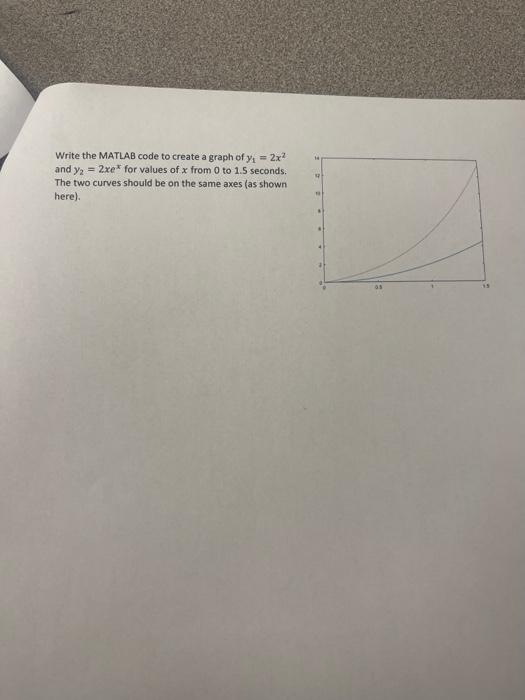
Write the MATLAB code to create a graph of y1=2x2 and y2=2xex for values of x from 0 to 1.5 seconds. The two curves should be on the same axes (as shown here)
Step by Step Solution
There are 3 Steps involved in it
1 Expert Approved Answer
Step: 1 Unlock

Question Has Been Solved by an Expert!
Get step-by-step solutions from verified subject matter experts
Step: 2 Unlock
Step: 3 Unlock