

Question: Write the Matlab script file that will output the following Figure and upload only the figure in the this forum: Knowing that y =
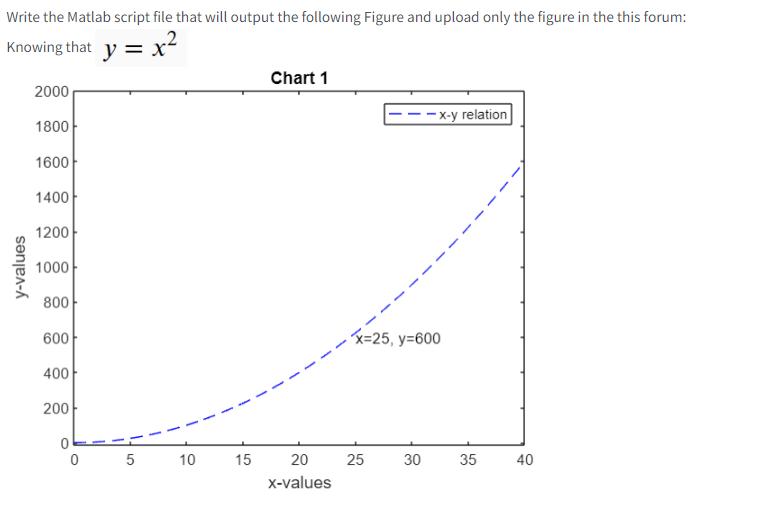
Write the Matlab script file that will output the following Figure and upload only the figure in the this forum: Knowing that y = x y-values 2000 1800 1600 1400 1200 1000 800 600 400 200 0 5 1 10 15 Chart 1 20 x-values x=25, y=600 25 *x-y relation 30 35 40
Step by Step Solution
There are 3 Steps involved in it
1 Expert Approved Answer
Step: 1 Unlock

It seems you would like to create a MATLAB script that generates the graph shown in the image The gr... View full answer
Question Has Been Solved by an Expert!
Get step-by-step solutions from verified subject matter experts
Step: 2 Unlock
Step: 3 Unlock