

Question: . Write up your report a Write a sentence explaining the results of your dependent samples: People at time 1 were happierl'less happy [M =
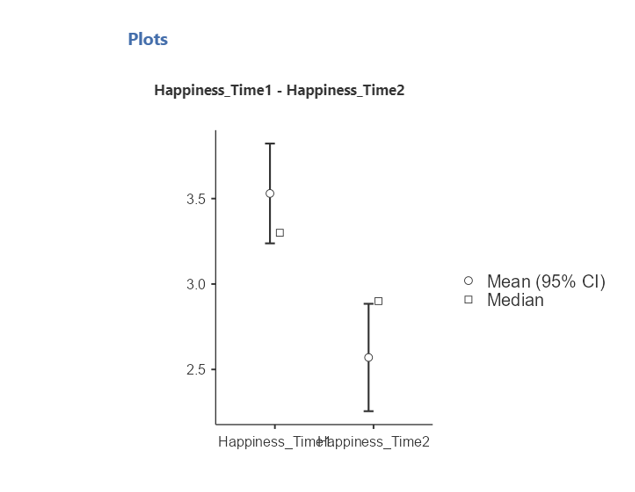
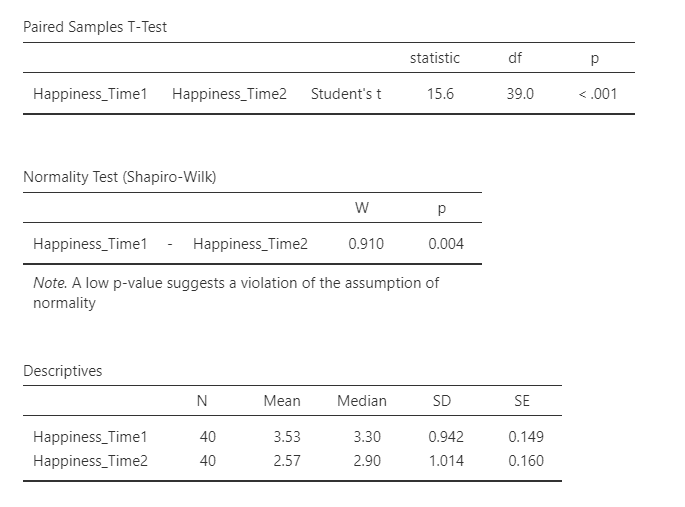
. Write up your report a Write a sentence explaining the results of your dependent samples: People at time 1 were happierl'less happy [M = #, SD 2 it} compared to time 2 {M = #, SD = it}, {not} = tobserved, p = pvalue. * Remember, everything is black should stay the exact same, the red is where you will put the statistics you calculated above. Example: Students consumed more servings of soda {M = 4.31 SD = 1.1?) than cups of coffee {M = 2.4, SD = 0.39}, {499} 2 12.14,,o <.d1 cl. in the population of all unl students drink more servings soda than coffee per week a write one sentence describing your conclusions. conclusions are own person opinions about why you got results did or implications these for real wodd. example: may because they want sugar with their caffeine. this explain increasing popularity gourmet drinks. plots happiness_time1 happiness_time2 o mean ci median happiness_timelappiness_time2paired samples t-test statistic df p student t normality test w note. low p-value suggests violation assumption descriptives n sd se happiness_time>
Step by Step Solution
There are 3 Steps involved in it

Get step-by-step solutions from verified subject matter experts