

Question: Write your work and answer for this quesion on the exam paper. Providing an answer without properly showing the work will not get any credit.
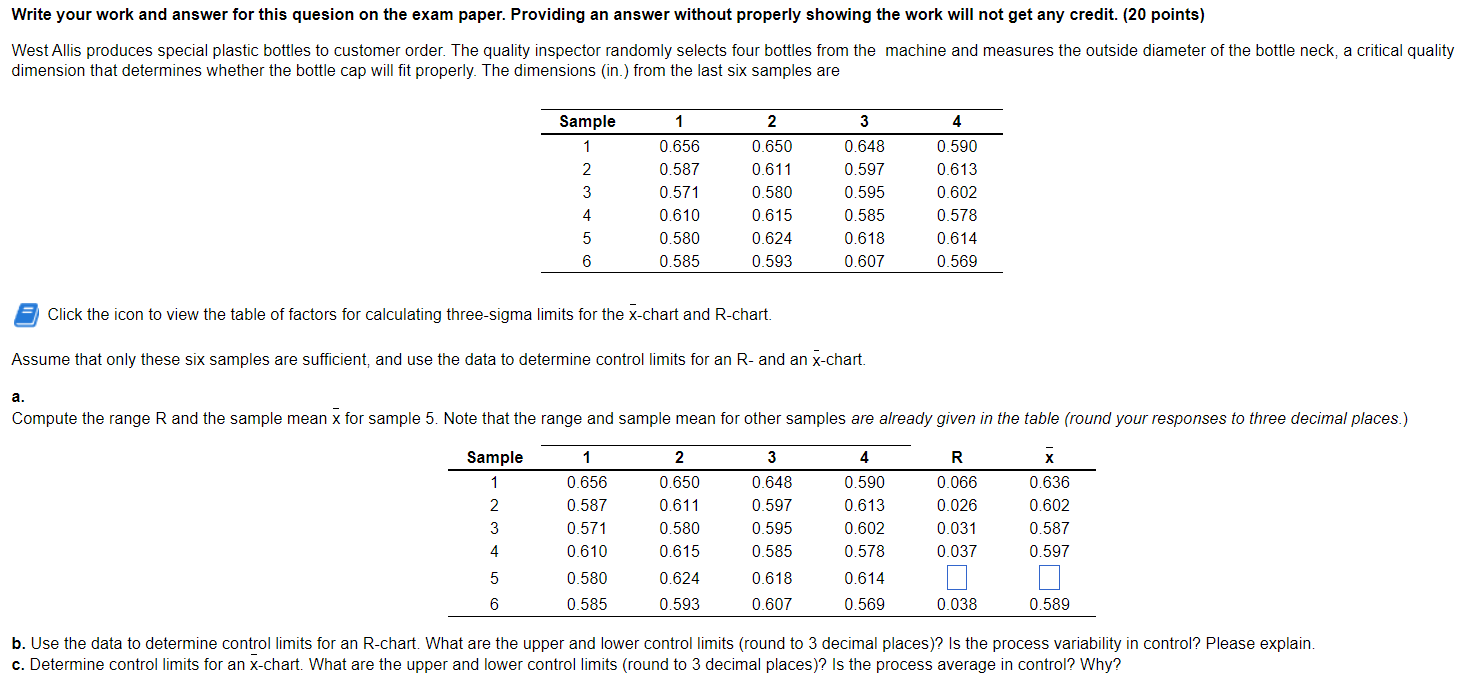
Write your work and answer for this quesion on the exam paper. Providing an answer without properly showing the work will not get any credit. (20 points) West Allis produces special plastic bottles to customer order. The quality inspector randomly selects four bottles from the machine and measures the outside diameter of the bottle neck, a critical quality dimension that determines whether the bottle cap will fit properly. The dimensions (in.) from the last six samples are Click the icon to view the table of factors for calculating three-sigma limits for the x-chart and R-chart. Assume that only these six samples are sufficient, and use the data to determine control limits for an R- and an x-chart. a. Compute the range R and the sample mean x for sample 5 . Note that the range and sample mean for other samples are already given in the table (round your responses to three decimal places.) b. Use the data to determine control limits for an R-chart. What are the upper and lower control limits (round to 3 decimal places)? Is the process variability in control? Please explain. c. Determine control limits for an x-chart. What are the upper and lower control limits (round to 3 decimal places)? Is the process average in control? Why
Step by Step Solution
There are 3 Steps involved in it

Get step-by-step solutions from verified subject matter experts