

Question: Written Assignment 1 Write careful, complete solutions for the following problems and submit them according to Directions 1or Submitting Written Assignments, under Orientation to STATS
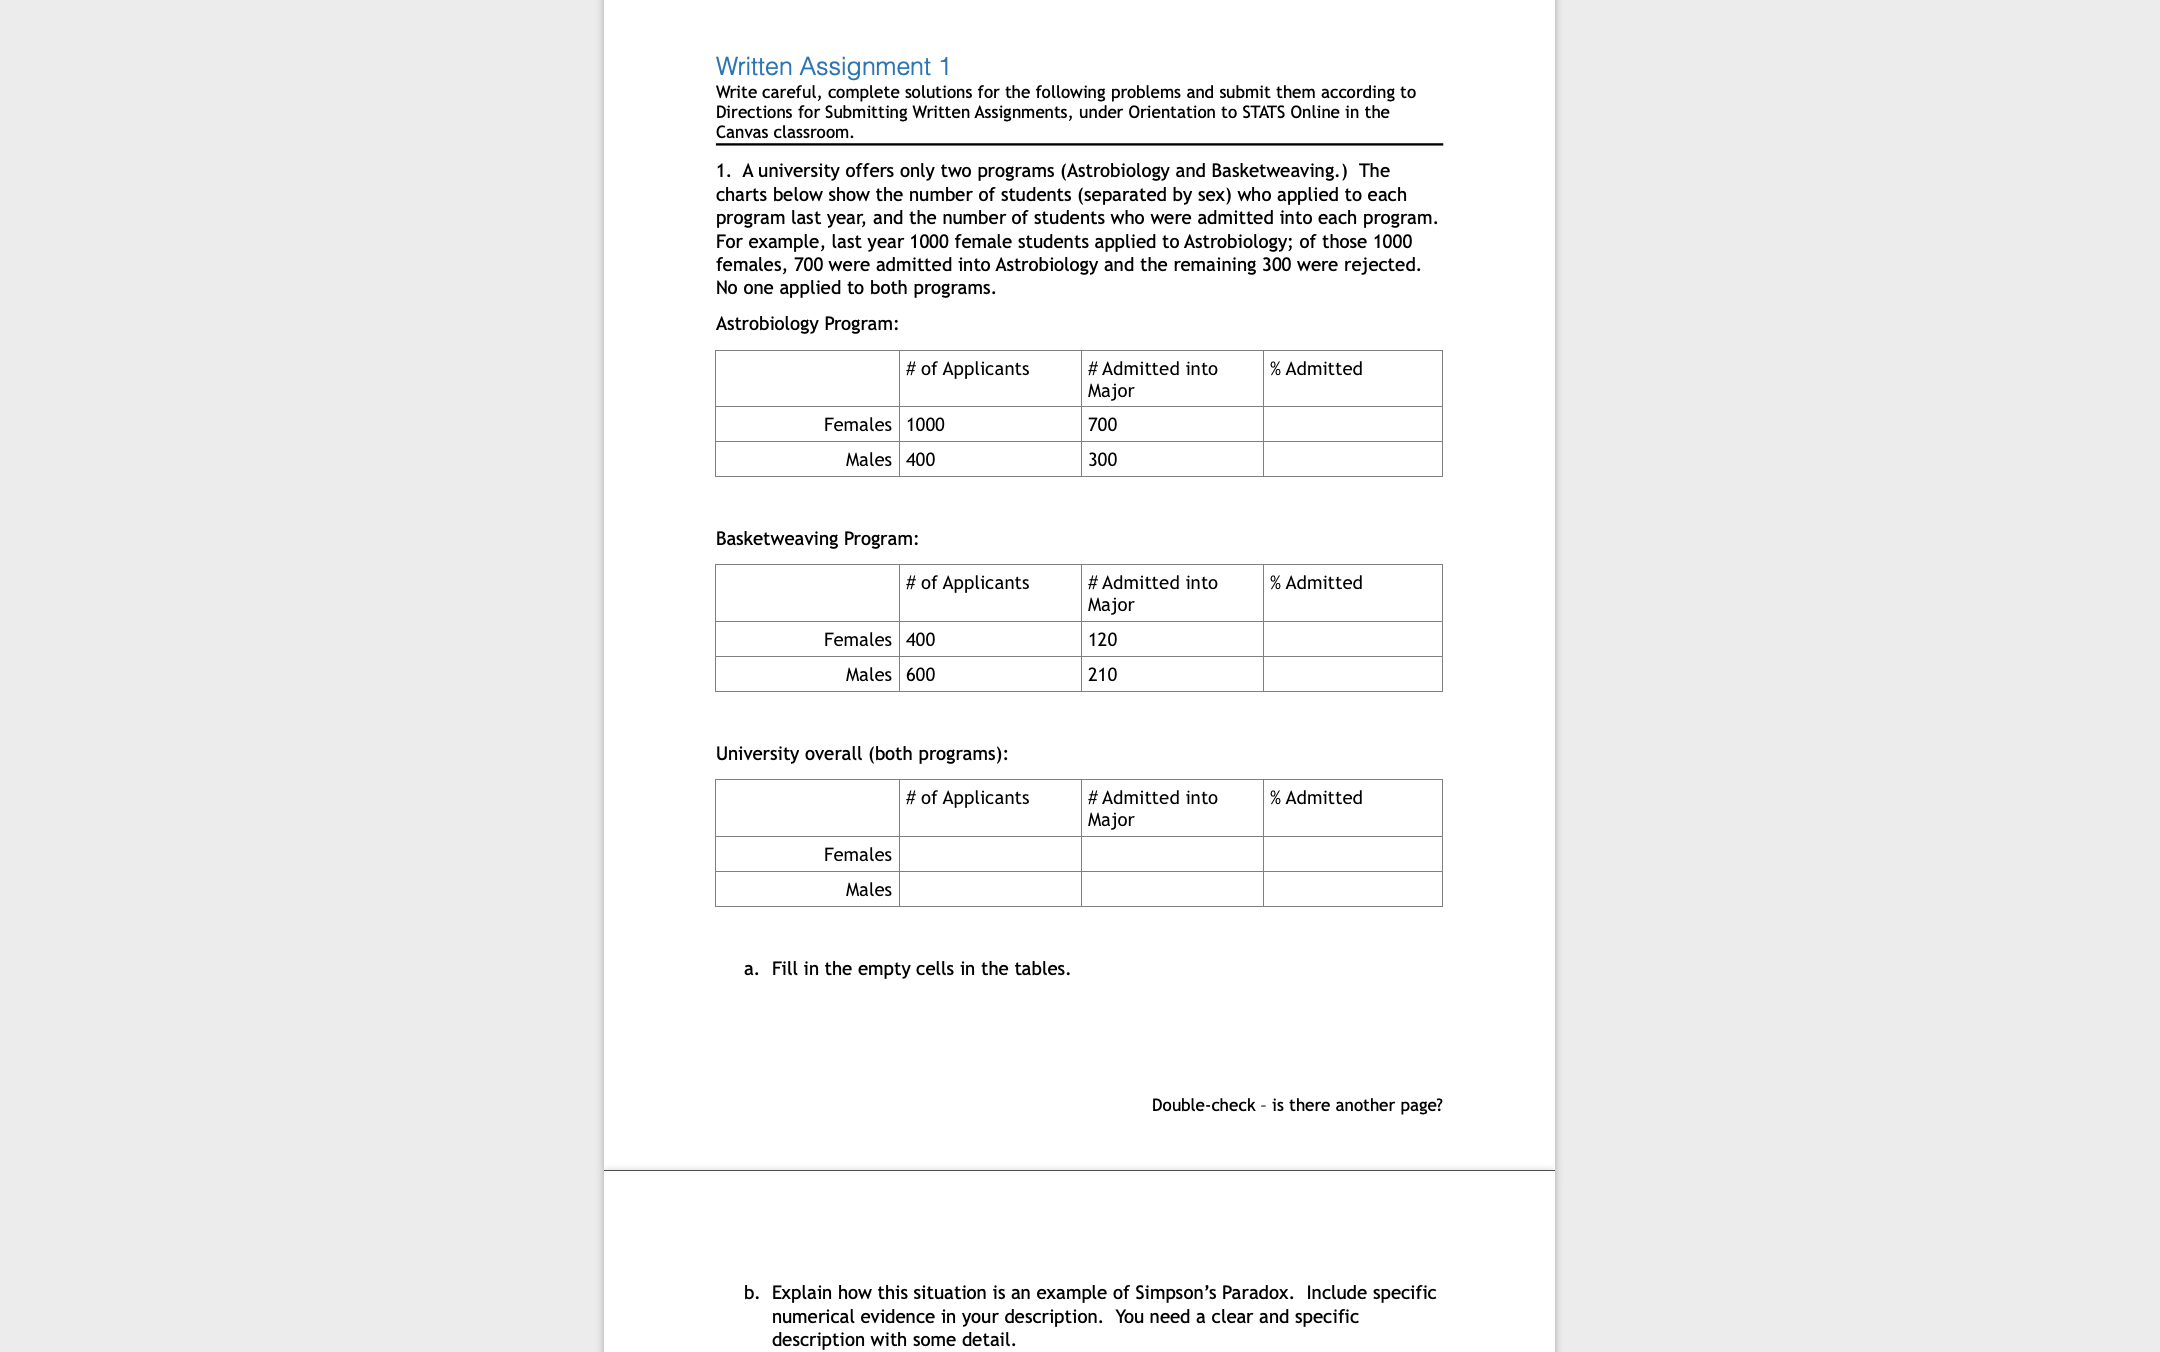
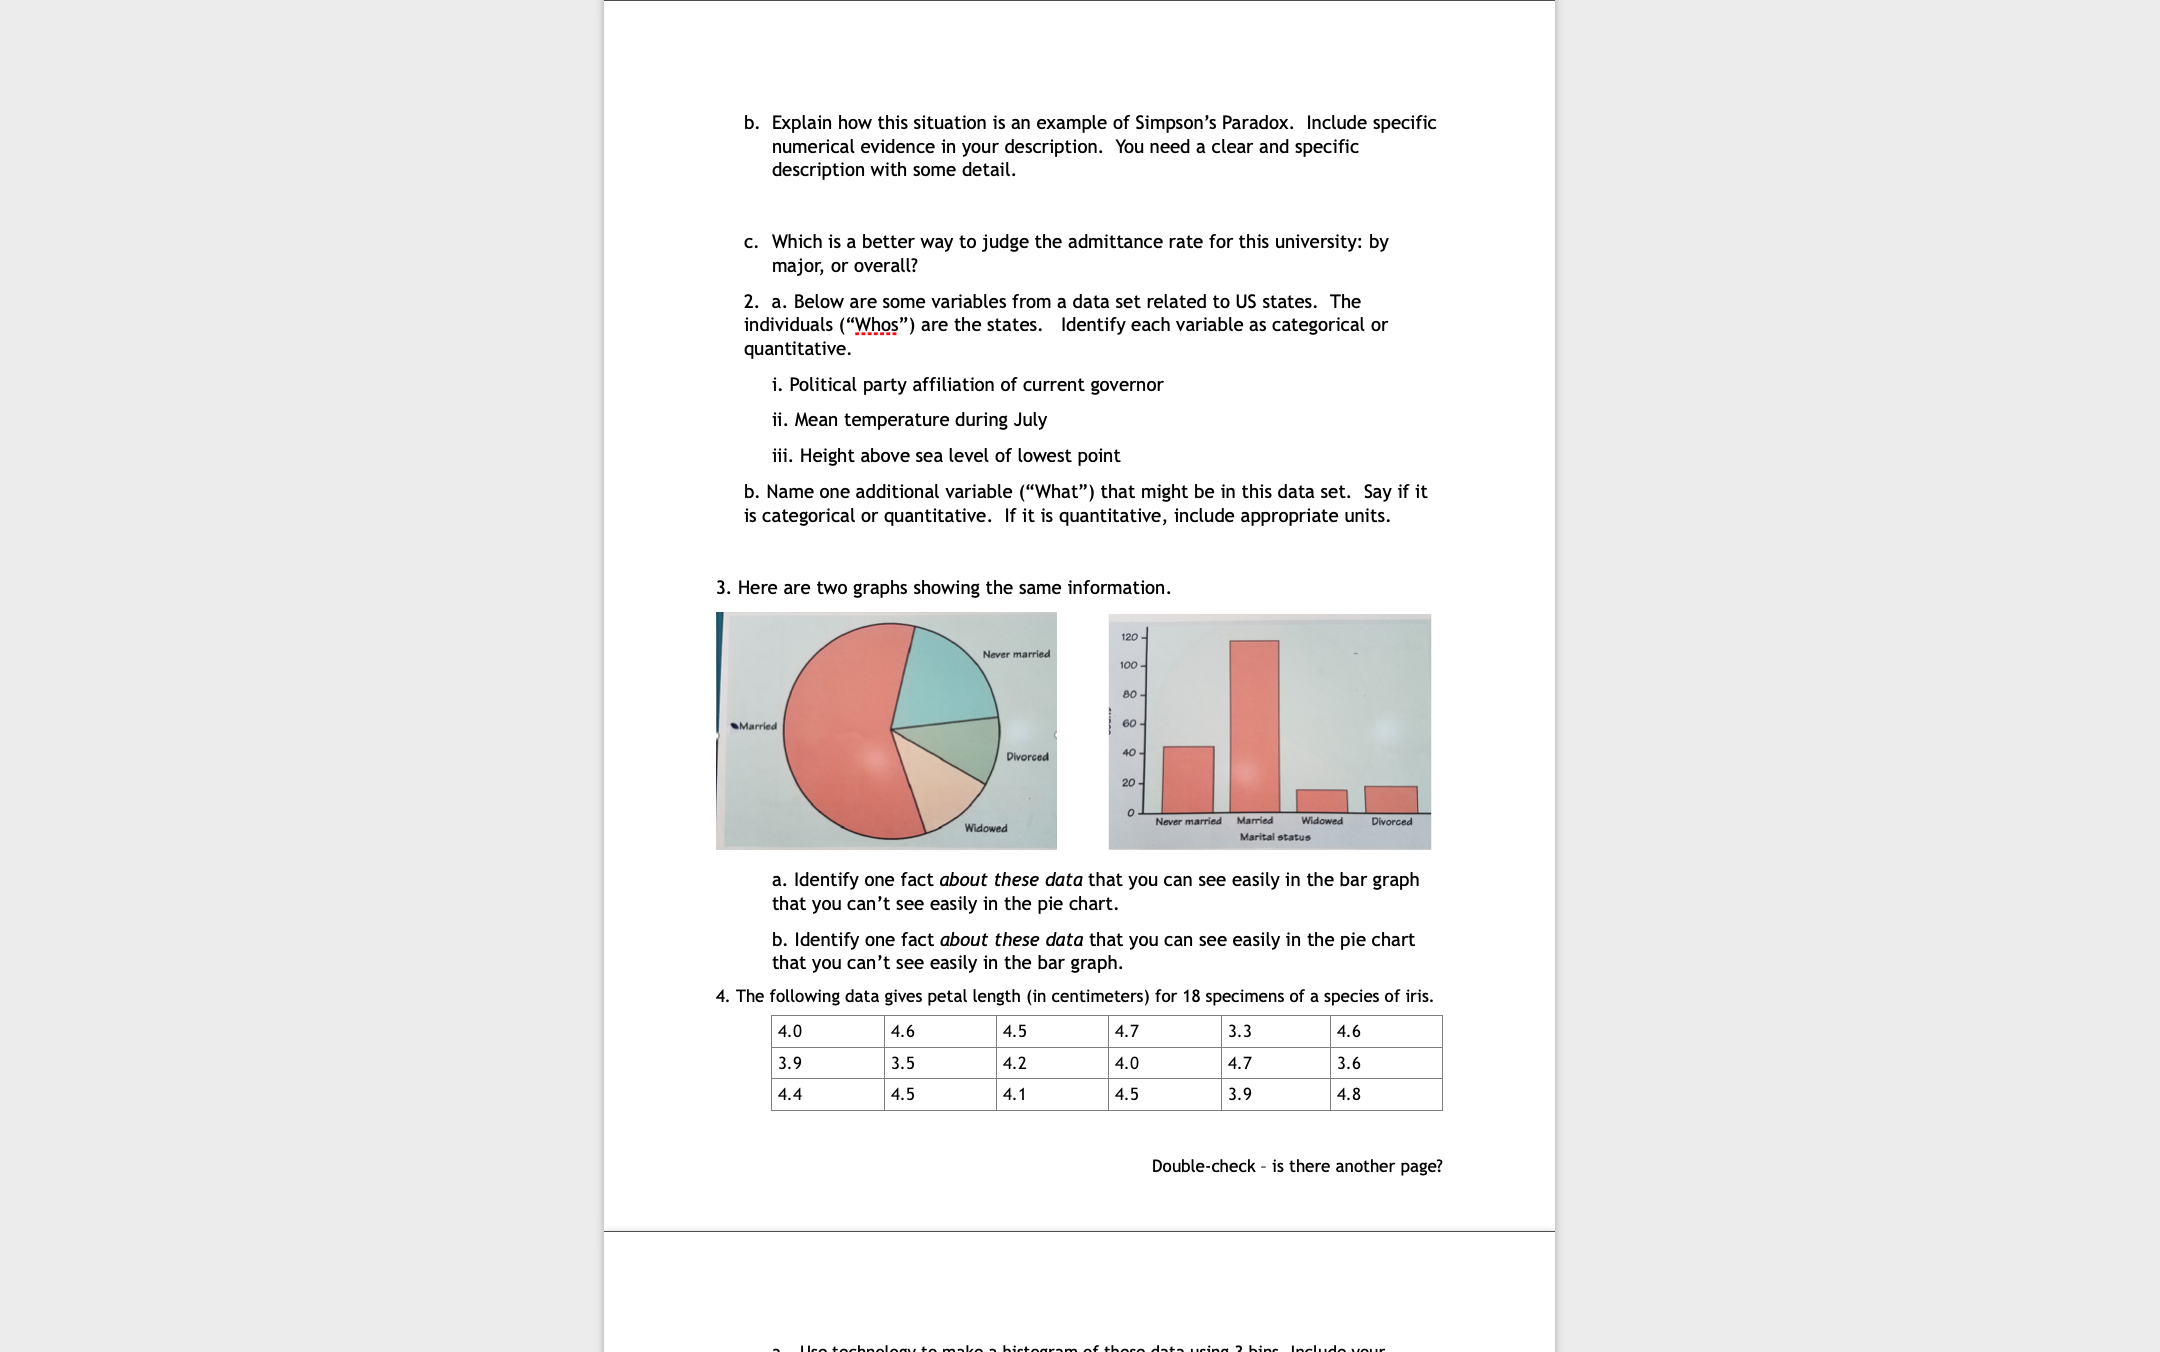
Written Assignment 1 Write careful, complete solutions for the following problems and submit them according to Directions 1or Submitting Written Assignments, under Orientation to STATS Online in the Canvas classroom. 1. A university offers only two programs (Astrobiology and BasketweavingJ The charts below show the number of students (separated by sexy who applied to each program last year, and the number of students who were admitted into each program. For example, last year 1000 female students applied to Astrobiology; of those 1000 females, 700 were admitted into Astrobiology and the remaining 300 were rejected. No one applied to both programs. Astrobiology Program: it of Applicants \"Admitted into % Admitted Major Females 1000 700 Males 400 300 Basketweaving Program: if of Applicants #Admitted into 96 Admitted Major Females 400 120 Mates 600 210 University overall (both programs): # of Applicants #Admitted into 96 Admitted Major Females Males a. Fill in the empty cells in the tables, Double-check - is there another page? 1), Explain how this situation is an example of Simpson's Paradox. Include specific numerical evidence in your description. You need a clear and specific description with some detail. b. Explain how this situation is an example of Simpson's Paradox. Include specific numerical evidence in your description. You need a clear and specific description with some detail. c. Which is a better way to judge the admittance rate for this university: by major, or overall? 2. a. Below are some variables from a data set related to US states. The individuals (\"M/hos\") are the states. Identify each variable as categorical or quantitative. i. Political party affiliation of current governor ii. Mean temperature during July iii. Height above sea level of lowest point b. Name one additional variable ("What") that might be in this data set. Sayi ' is categorical or quantitative. If it is quantitative, include appropriate units. 3. Here are two graphs showing the same information. a. Identify one fact about these data that you can see easily in the bar graph that you can't see easily in the pie chart. b. Identify one fact about these data that you can see easily in the pie chart that you can't see easily in the bar graph. 4. The following data gives petal length (in centimeters) for 18 specimens of a species of iris. 4.0 4.6 4.5 4.7 3.3 4.5 3.9 3.5 4.2 4.0 4.7 3.5 4.4 4.5 4.1 4.5 3.9 4.8 Double-check - is there another page? _ n._ suldes... .__|._ _ Let\"... c: .L..- a. ...:.... a Li... lr-I..J .m
Step by Step Solution
There are 3 Steps involved in it

Get step-by-step solutions from verified subject matter experts