

Question: Written Assignment 4 Use the results from the Student Data Table to complete the following questions. Standard Scores 1. Use both the Student ID
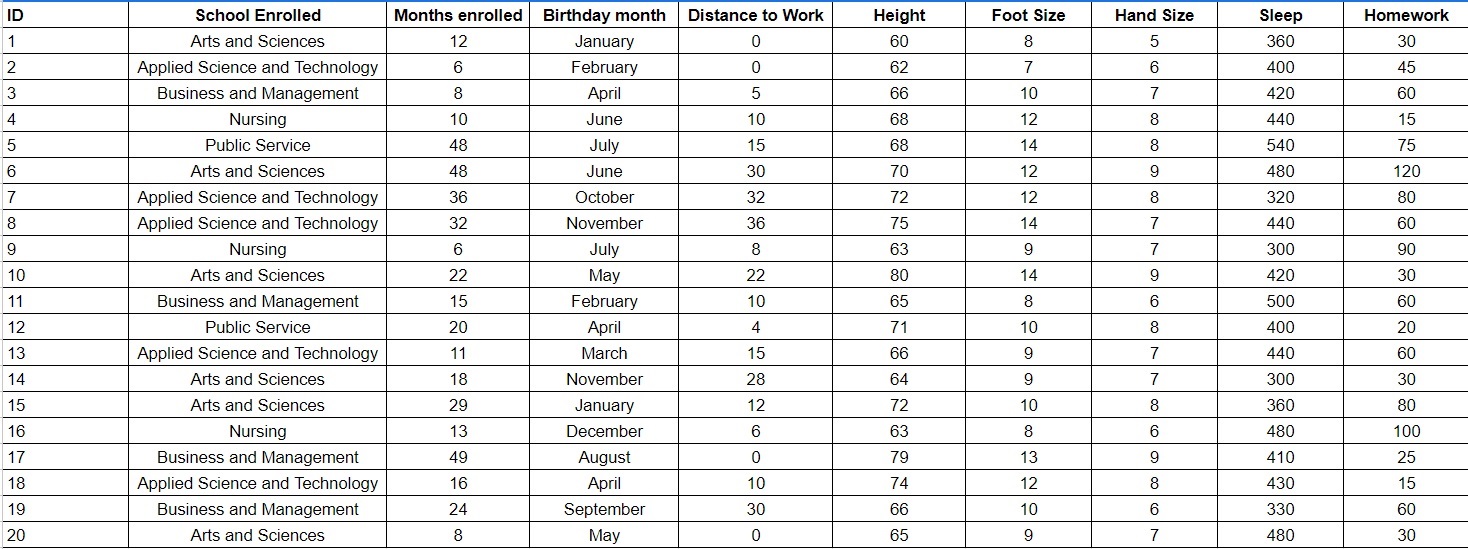
Written Assignment 4 Use the results from the Student Data Table to complete the following questions. Standard Scores 1. Use both the Student ID and Distance to Work variables. 2. List the Student ID at TESU in ascending order of Distance to Work. 3. Calculate the z-scores associated with each student (use the sample standard deviation for this calculation). 4. Identify potential outliers and explain your reasoning. Confidence Intervals/Samples 1. Take a sample of the first four data points for the variable Distance to Work (unsorted-use the original order in the dataset). 2. Determine the 95% and 99% confidence intervals using the same size of 4. 3. Describe and compare the two intervals. 1. Take a sample of the first seven data points for the variable Distance to Work (unsorted - use the original order in the dataset). 2. Determine the 95% confidence interval. Use the same mean and SD, but change the sample size to 20 and determine the 95% confidence interval. 3. Describe and compare the two intervals. A grading rubric for Written Assignment 4 can be found in the Evaluation Rubrics folder in Moodle. 0123456700 ID Applied Science and Technology School Enrolled Arts and Sciences Business and Management Nursing Public Service Months enrolled Birthday month Distance to Work Height Foot Size Hand Size Sleep Homework 12 January 0 60 8 5 360 30 6 February 0 62 7 6 400 45 8 April 5 66 10 7 420 60 10 June 10 68 12 8 440 15 48 July 15 68 14 8 540 75 Arts and Sciences 48 June 30 70 12 9 480 120 Applied Science and Technology 36 October 32 72 12 8 320 80 8 Applied Science and Technology 32 November 36 75 14 7 440 60 9 Nursing 6 July 8 63 9 7 300 90 10 Arts and Sciences 22 May 22 80 14 9 420 30 11 Business and Management 15 February 10 65 8 6 500 60 12 Public Service 20 April 4 71 10 8 400 20 13 Applied Science and Technology 11 March 15 66 9 7 440 60 14 Arts and Sciences 18 November 28 64 9 7 300 30 15 Arts and Sciences 29 January 12 72 10 8 360 80 16 Nursing 13 December 6 63 8 7222 Business and Management 49 August 0 79 13 Applied Science and Technology 16 April 10 74 12 19 Business and Management 24 September 30 66 10 20 Arts and Sciences 8 May 0 65 9 69867 480 100 410 25 430 15 330 60 480 30
Step by Step Solution
There are 3 Steps involved in it

Get step-by-step solutions from verified subject matter experts