

Question: Written Homework 1 Math& 146 The data we are working on are listed in this file, but the most efficient way is to get
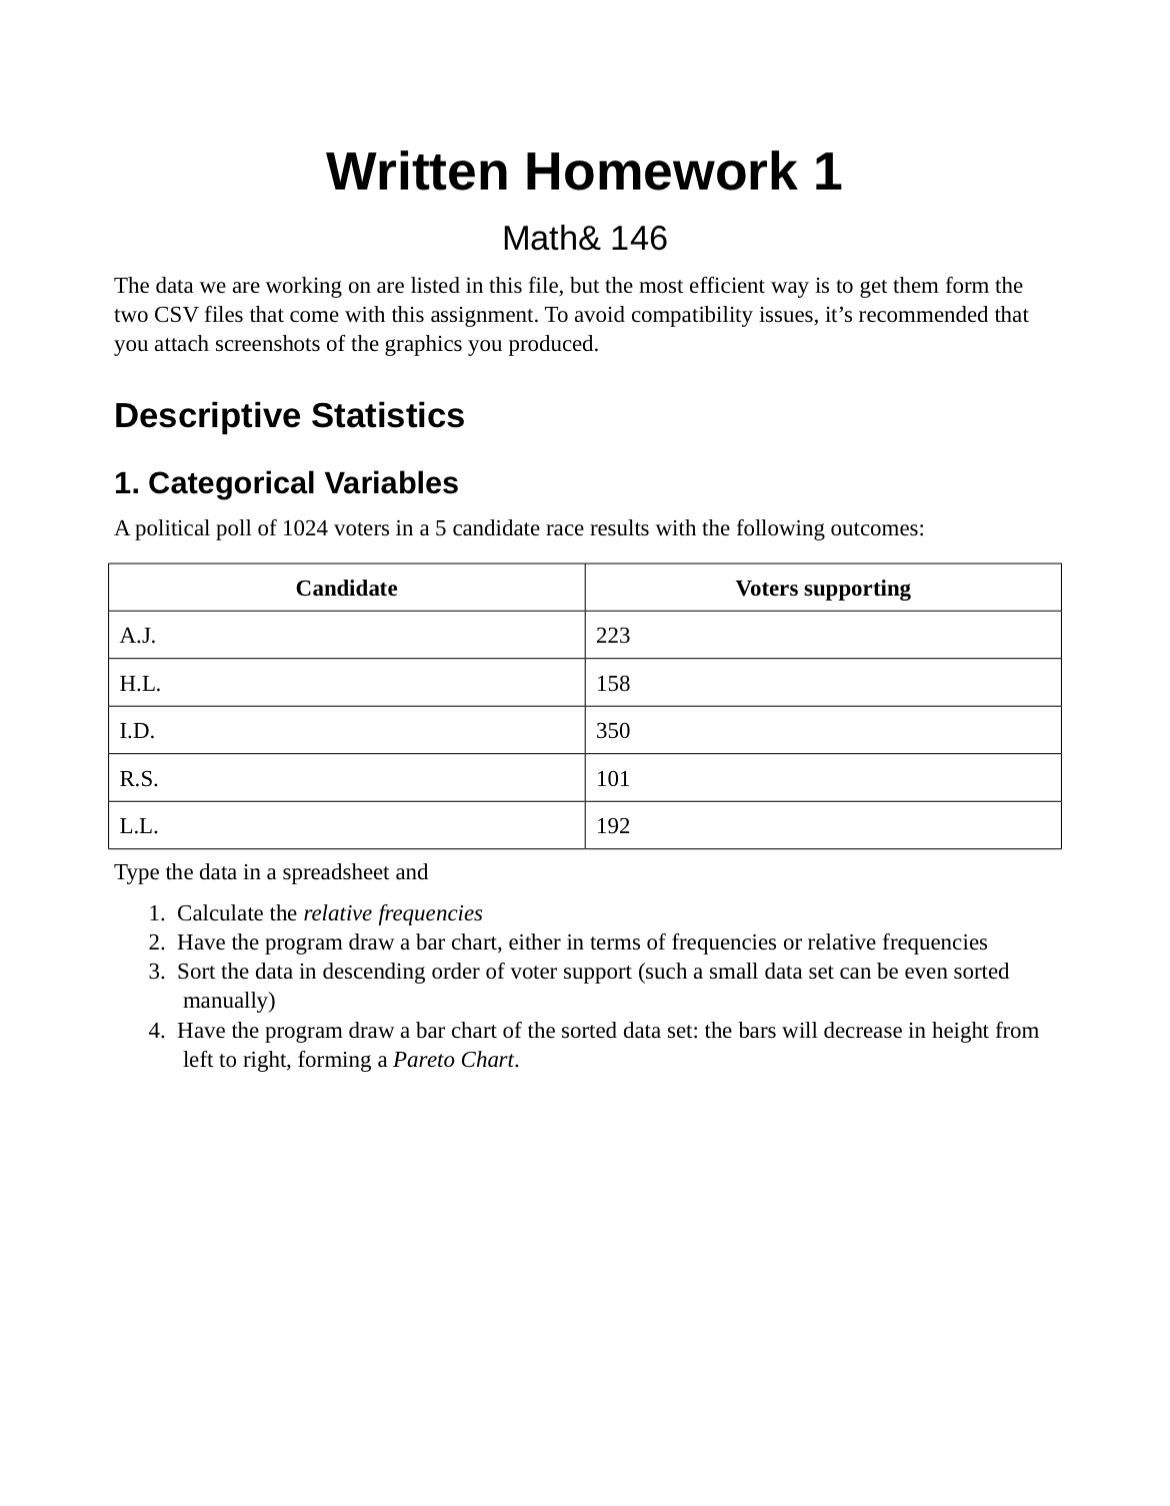
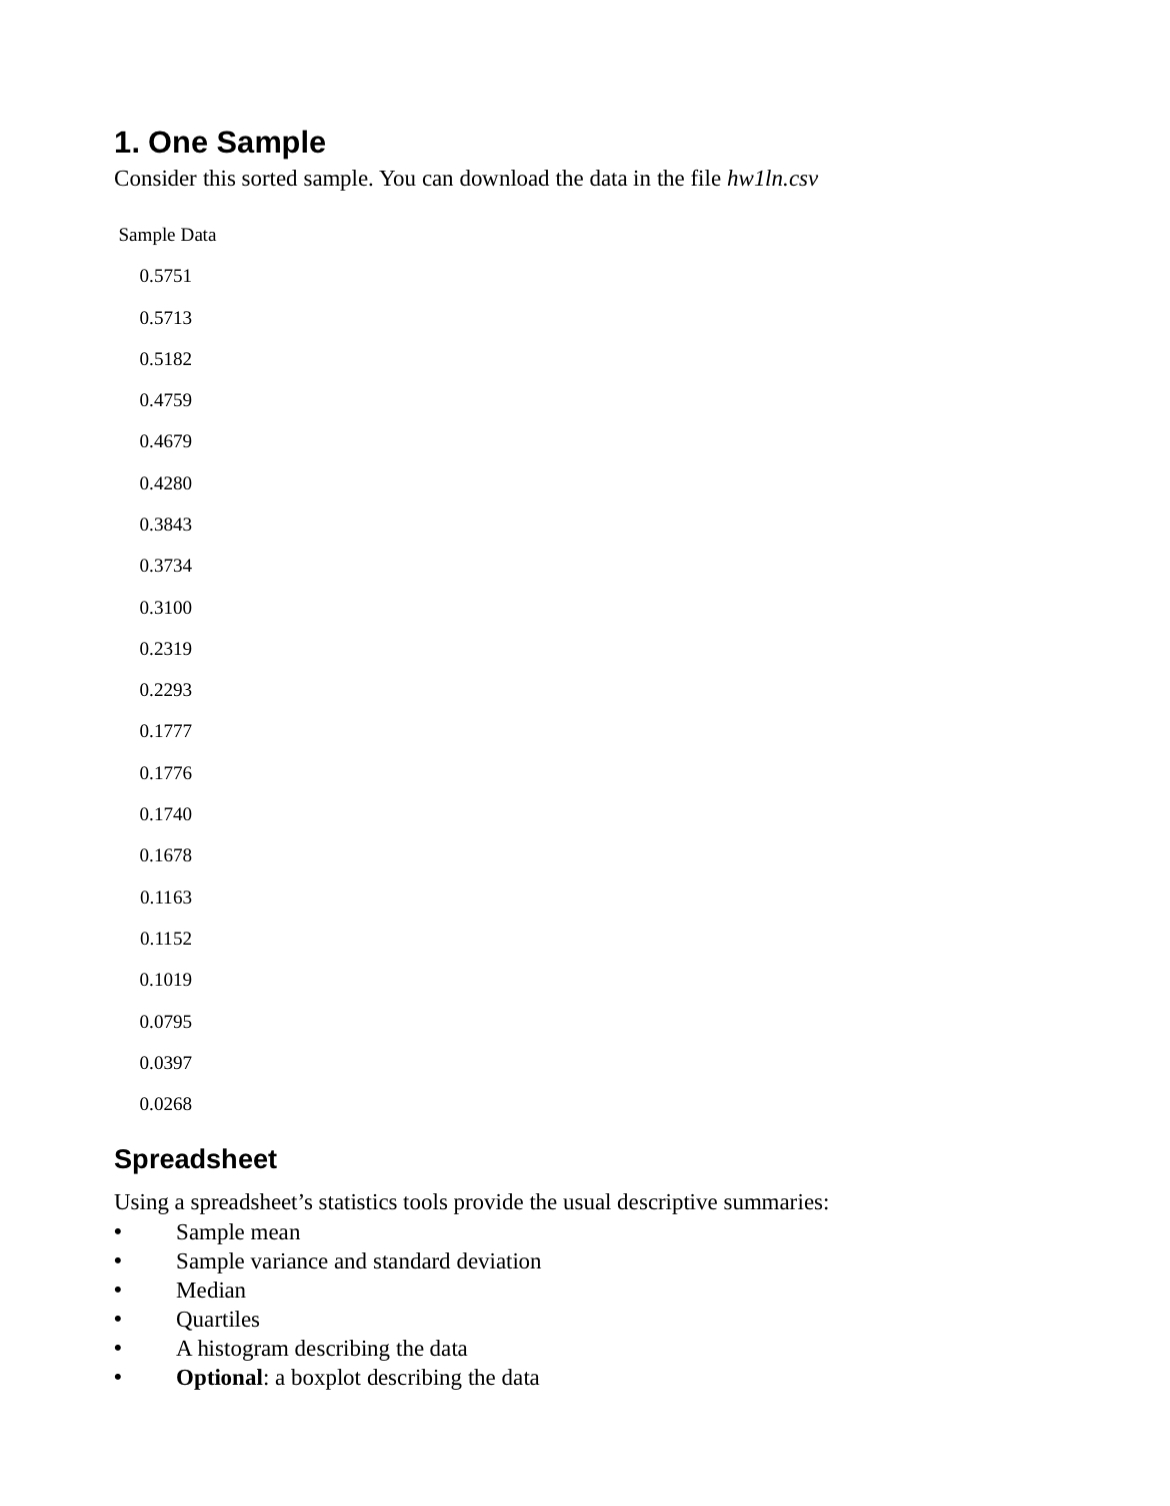
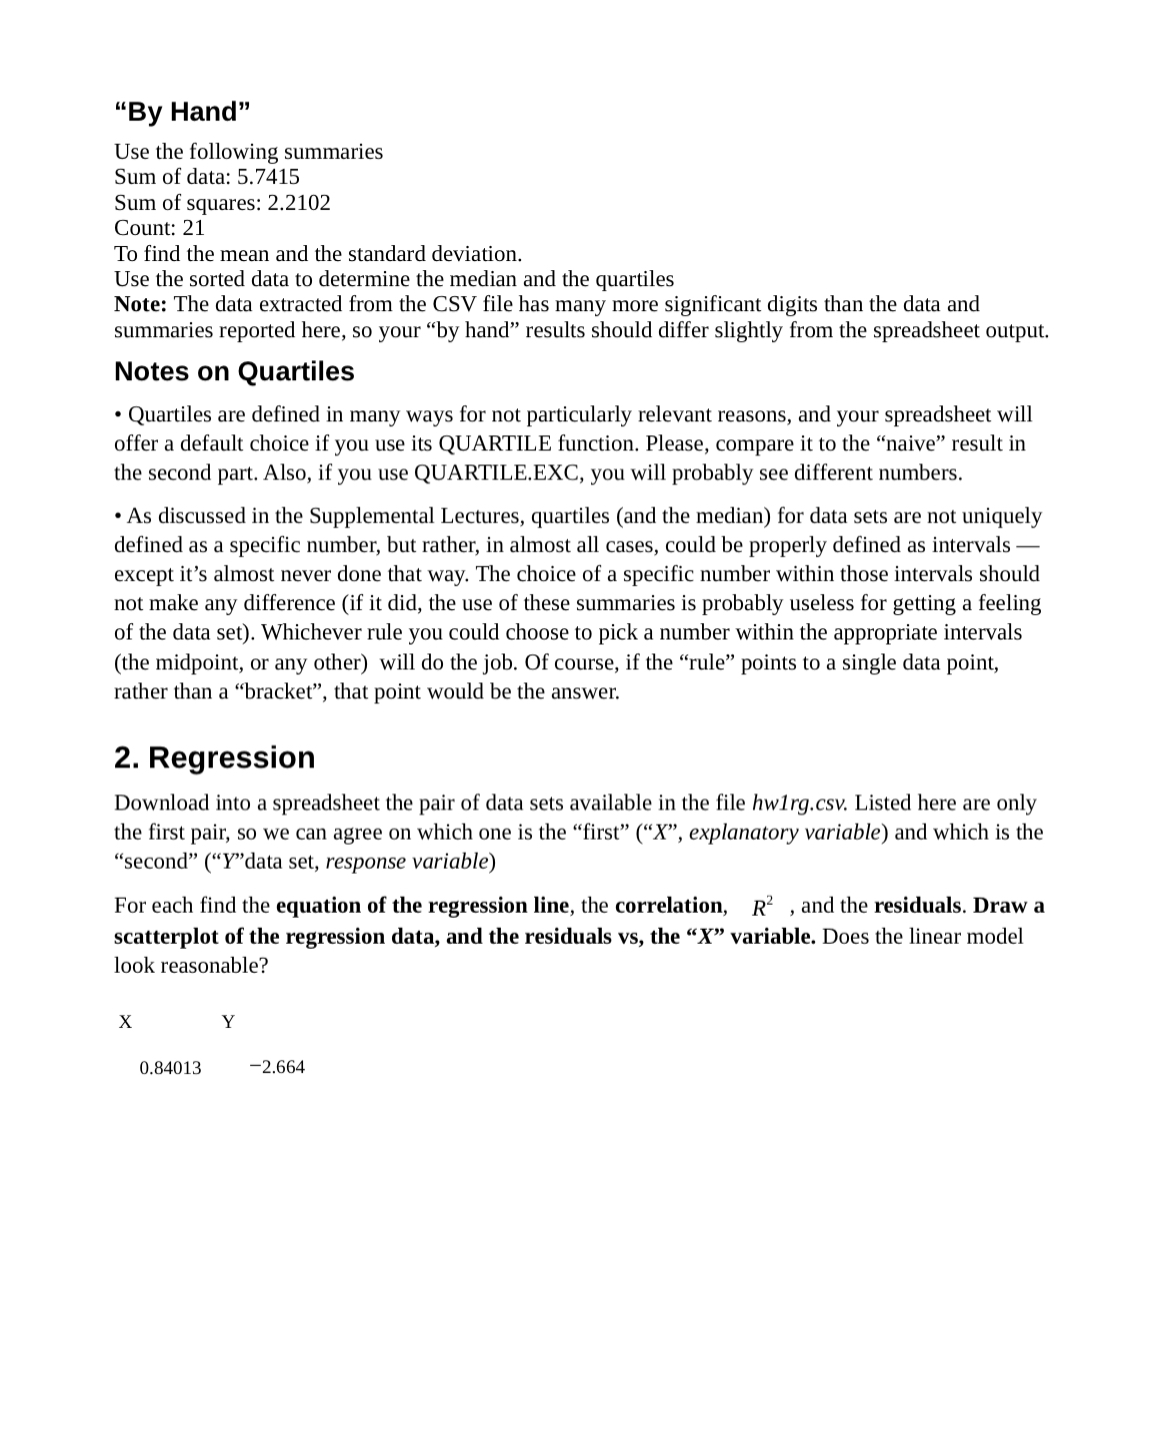
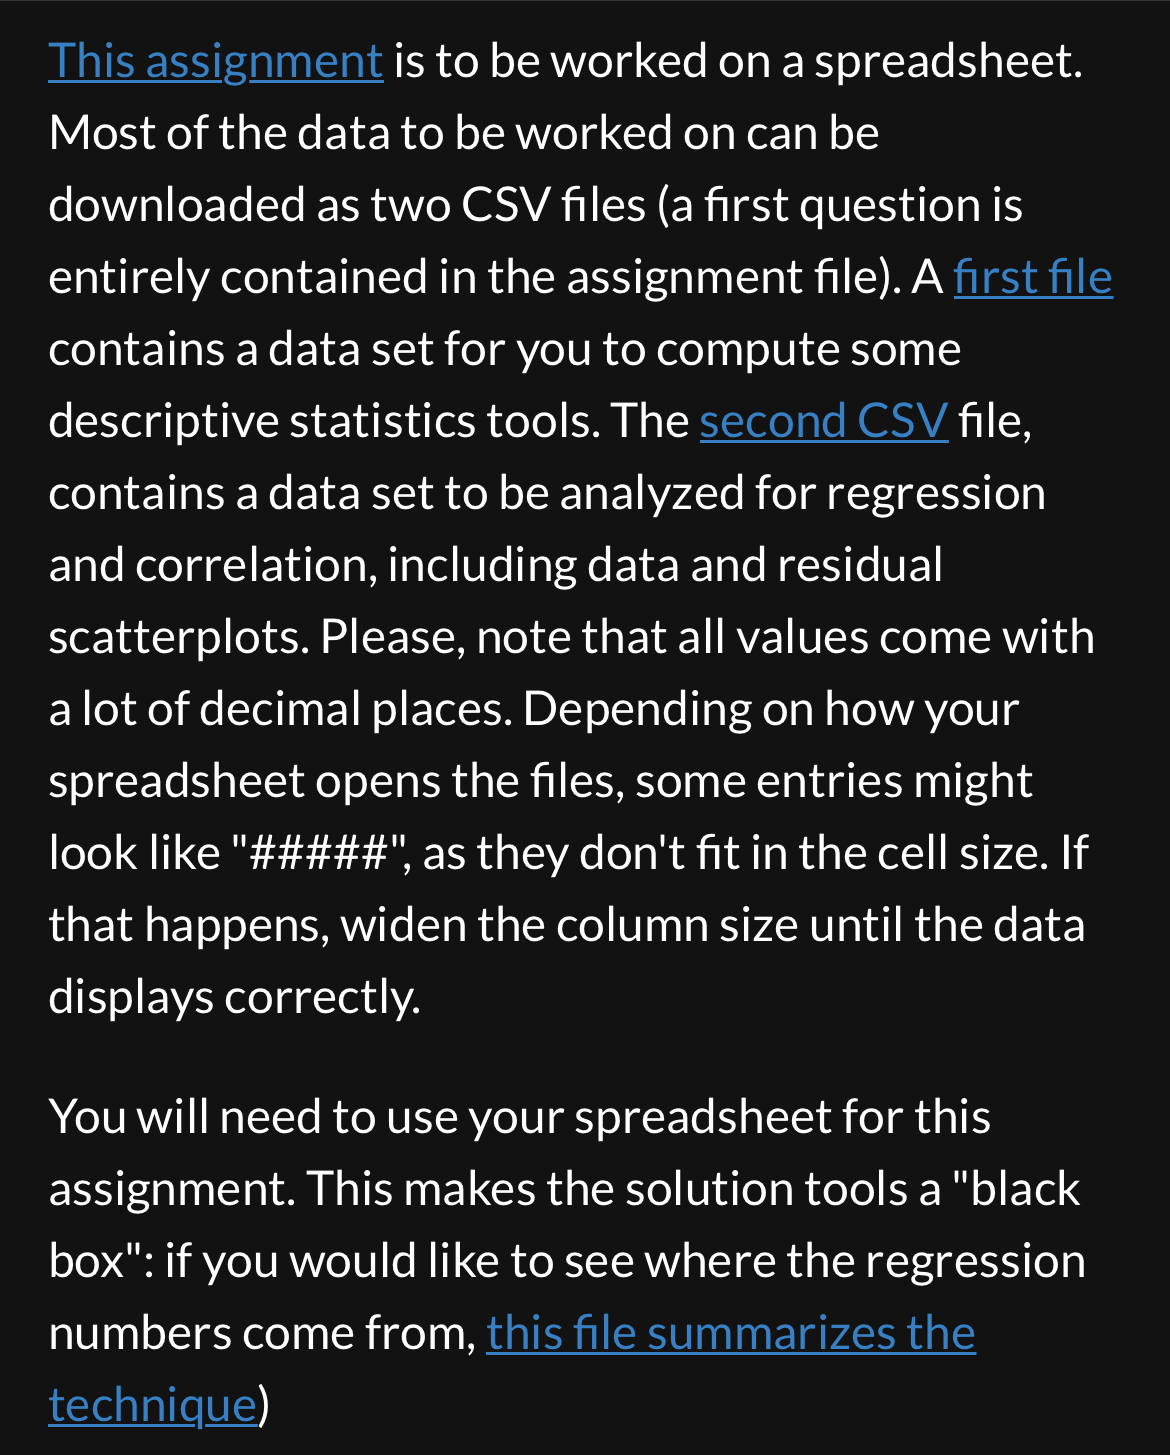
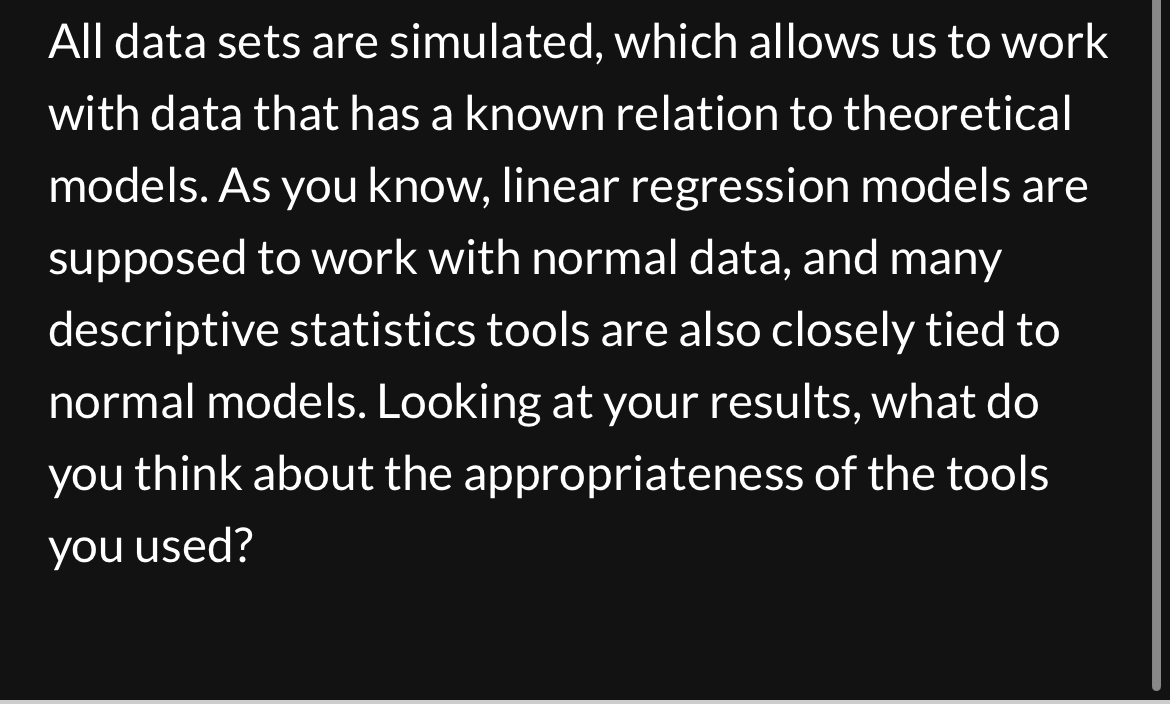
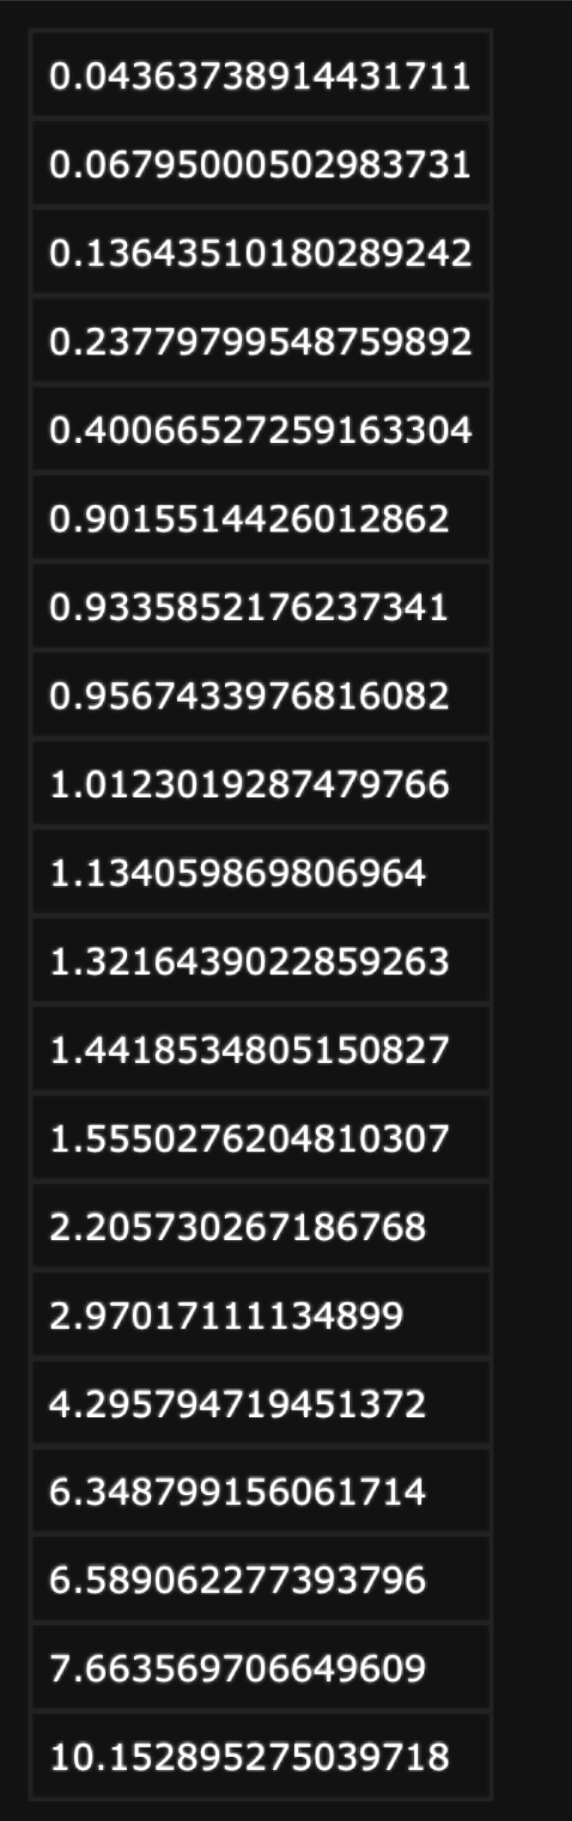
Written Homework 1 Math& 146 The data we are working on are listed in this file, but the most efficient way is to get them form the two CSV files that come with this assignment. To avoid compatibility issues, it's recommended that you attach screenshots of the graphics you produced. Descriptive Statistics 1. Categorical Variables A political poll of 1024 voters in a 5 candidate race results with the following outcomes: Voters supporting A.J. H.L. I.D. R.S. L.L. Candidate Type the data in a spreadsheet and 223 158 350 101 192 1. Calculate the relative frequencies 2. Have the program draw a bar chart, either in terms of frequencies or relative frequencies 3. Sort the data in descending order of voter support (such a small data set can be even sorted manually) 4. Have the program draw a bar chart of the sorted data set: the bars will decrease in height from left to right, forming a Pareto Chart. 1. One Sample Consider this sorted sample. You can download the data in the file hw1ln.csv Sample Data 0.5751 0.5713 0.5182 0.4759 0.4679 0.4280 0.3843 0.3734 0.3100 0.2319 0.2293 0.1777 0.1776 0.1740 0.1678 0.1163 0.1152 0.1019 0.0795 0.0397 0.0268 Spreadsheet Using a spreadsheet's statistics tools provide the usual descriptive summaries: Sample mean Sample variance and standard deviation Median Quartiles A histogram describing the data Optional: a boxplot describing the data "By Hand" Use the following summaries Sum of data: 5.7415 Sum of squares: 2.2102 Count: 21 To find the mean and the standard deviation. Use the sorted data to determine the median and the quartiles Note: The data extracted from the CSV file has many more significant digits than the data and summaries reported here, so your "by hand" results should differ slightly from the spreadsheet output. Notes on Quartiles Quartiles are defined in many ways for not particularly relevant reasons, and your spreadsheet will offer a default choice if you use its QUARTILE function. Please, compare it to the "naive" result in the second part. Also, if you use QUARTILE. EXC, you will probably see different numbers. As discussed in the Supplemental Lectures, quartiles (and the median) for data sets are not uniquely defined as a specific number, but rather, in almost all cases, could be properly defined as intervals - except it's almost never done that way. The choice of a specific number within those intervals should not make any difference (if it did, the use of these summaries is probably useless for getting a feeling of the data set). Whichever rule you could choose to pick a number within the appropriate intervals (the midpoint, or any other) will do the job. Of course, if the "rule" points to a single data point, rather than a "bracket", that point would be the answer. 2. Regression Download into a spreadsheet the pair of data sets available in the file hw1rg.csv. Listed here are only the first pair, so we can agree on which one is the "first" ("X", explanatory variable) and which is the "second" ("Y"data set, response variable) For each find the equation of the regression line, the correlation, R2, and the residuals. Draw a scatterplot of the regression data, and the residuals vs, the "X" variable. Does the linear model look reasonable? X 0.84013 Y -2.664 This assignment is to be worked on a spreadsheet. Most of the data to be worked on can be downloaded as two CSV files (a first question is entirely contained in the assignment file). A first file contains a data set for you to compute some descriptive statistics tools. The second CSV file, contains a data set to be analyzed for regression and correlation, including data and residual scatterplots. Please, note that all values come with a lot of decimal places. Depending on how your spreadsheet opens the files, some entries might look like "#####", as they don't fit in the cell size. If that happens, widen the column size until the data displays correctly. You will need to use your spreadsheet for this assignment. This makes the solution tools a "black box": if you would like to see where the regression numbers come from, this file summarizes the technique) All data sets are simulated, which allows us to work with data that has a known relation to theoretical models. As you know, linear regression models are supposed to work with normal data, and many descriptive statistics tools are also closely tied to normal models. Looking at your results, what do you think about the appropriateness of the tools you used? 0.04363738914431711 0.06795000502983731 0.13643510180289242 0.23779799548759892 0.40066527259163304 0.9015514426012862 0.9335852176237341 0.9567433976816082 1.0123019287479766 1.134059869806964 1.3216439022859263 1.4418534805150827 1.5550276204810307 2.205730267186768 2.97017111134899 4.295794719451372 6.348799156061714 6.589062277393796 7.663569706649609 10.152895275039718 1st Data Set "X" "y" 1.2817007580861017 3.0597973489405845 2.376420365944906 8.470453664107234 1.1430520557315158 5.130411840828759 2.5279376196992893 10.099898424968508 0.3706438137008703 2.1811696427517964 2.959539544774655 11.362072274164017 2.1889962093387356 7.7133101850327614 1.600063809150629 6.394981585200603 0.18720187822811907 2.4961552684736072 2.5507085597056287 10.209254533406241 2.5531874122017273 9.11863609963924 1.5266606493550596 6.105852870396662 2.1858079142261433 8.094174021733737 1.6860545458918421 7.1609840010571535 1.6074066771243272 6.700339839245226 0.6545422641464371 3.3224091024931623 1.7866979232982245 8.283569406783386 0.9697379102353828 4.506592356667577 1.3861601201231428 5.77233535584033 8.536753564897758 3.6264757386895754 12.133267545652172 2.33273802900899 1.254581485064353 5.550740338210396 2.274971975431862 7.475398301044472 1.1870475640999327 4.531852342783179 0.524840878909667 4.613427106302201 2.6870009767885796 10.926537613968403 2.0249072100424015 6.07601655688056 2.085277201385929 8.051819184034017 1.7159116167514785 6.898197920347267 2.4488566844034367 7.335798533610307 1.8914100309895967 7.006132563076974 1.888897644379434 7.388854655259849 0.5517429650585941 4.039522774177144 2nd Data Set "X" 0.5359984460968357 0.9786281632642645 0.03496490225612253 1.7634732785487395 4.6868985569442465 1.087519159352847 0.87303410934061 1.505400863825309 0.8411937523252973 -0.3086601282325898 -0.2991316389608016 3.0985611301045854 2.714064758522485 "Y" -0.8320134502440834 3.4493974579270588 73.11589567275712 0.3859873525978551 -0.07176557925012905 -1.0003666060541945 0.5533178083379825 -0.8144599852537133 0.3546853040982446 -0.953497361311398 21.20890933811937 0.9177138238230635 -0.2130915207843057 1.4491385649548576 2.874500680838455 2.8474292378004527 34.26760773922827 0.2744411896960006 -0.9782504822974398 1.3174664527647149 1.9603191146505723 2.0140657166579614 10.059287359310044 1.6339795645711006 3.706554501828173 -0.12683279558854066 -1.002035720700646 0.5145437699968703 0.35388938193593245 -0.9528176641574884 1.218445861930585 0.91359327119902 -0.156109510836771 0.8250942538761956 -0.381027708958766 1.7994181510682272 6.251725817411769 0.6376123669966351 -0.7317346223074606 1.284743711554868 1.5529042811464948 1.1247898984545943 1.1689205865436842 0.8071043294336717 -0.8531292723618508 1.4658605484408405 2.828464405949893 1.0954892826254223 3.5541443854693955 0.9900939273608875 0.009796675406737128 1.854428645570465 5.897620311162609
Step by Step Solution
There are 3 Steps involved in it

Get step-by-step solutions from verified subject matter experts