

Question: Written Work #2: Sections 1.5 - 1.6 and 2.1 Math 241, Fall '21 3. The graph below shows the purchasing power of $100 in the
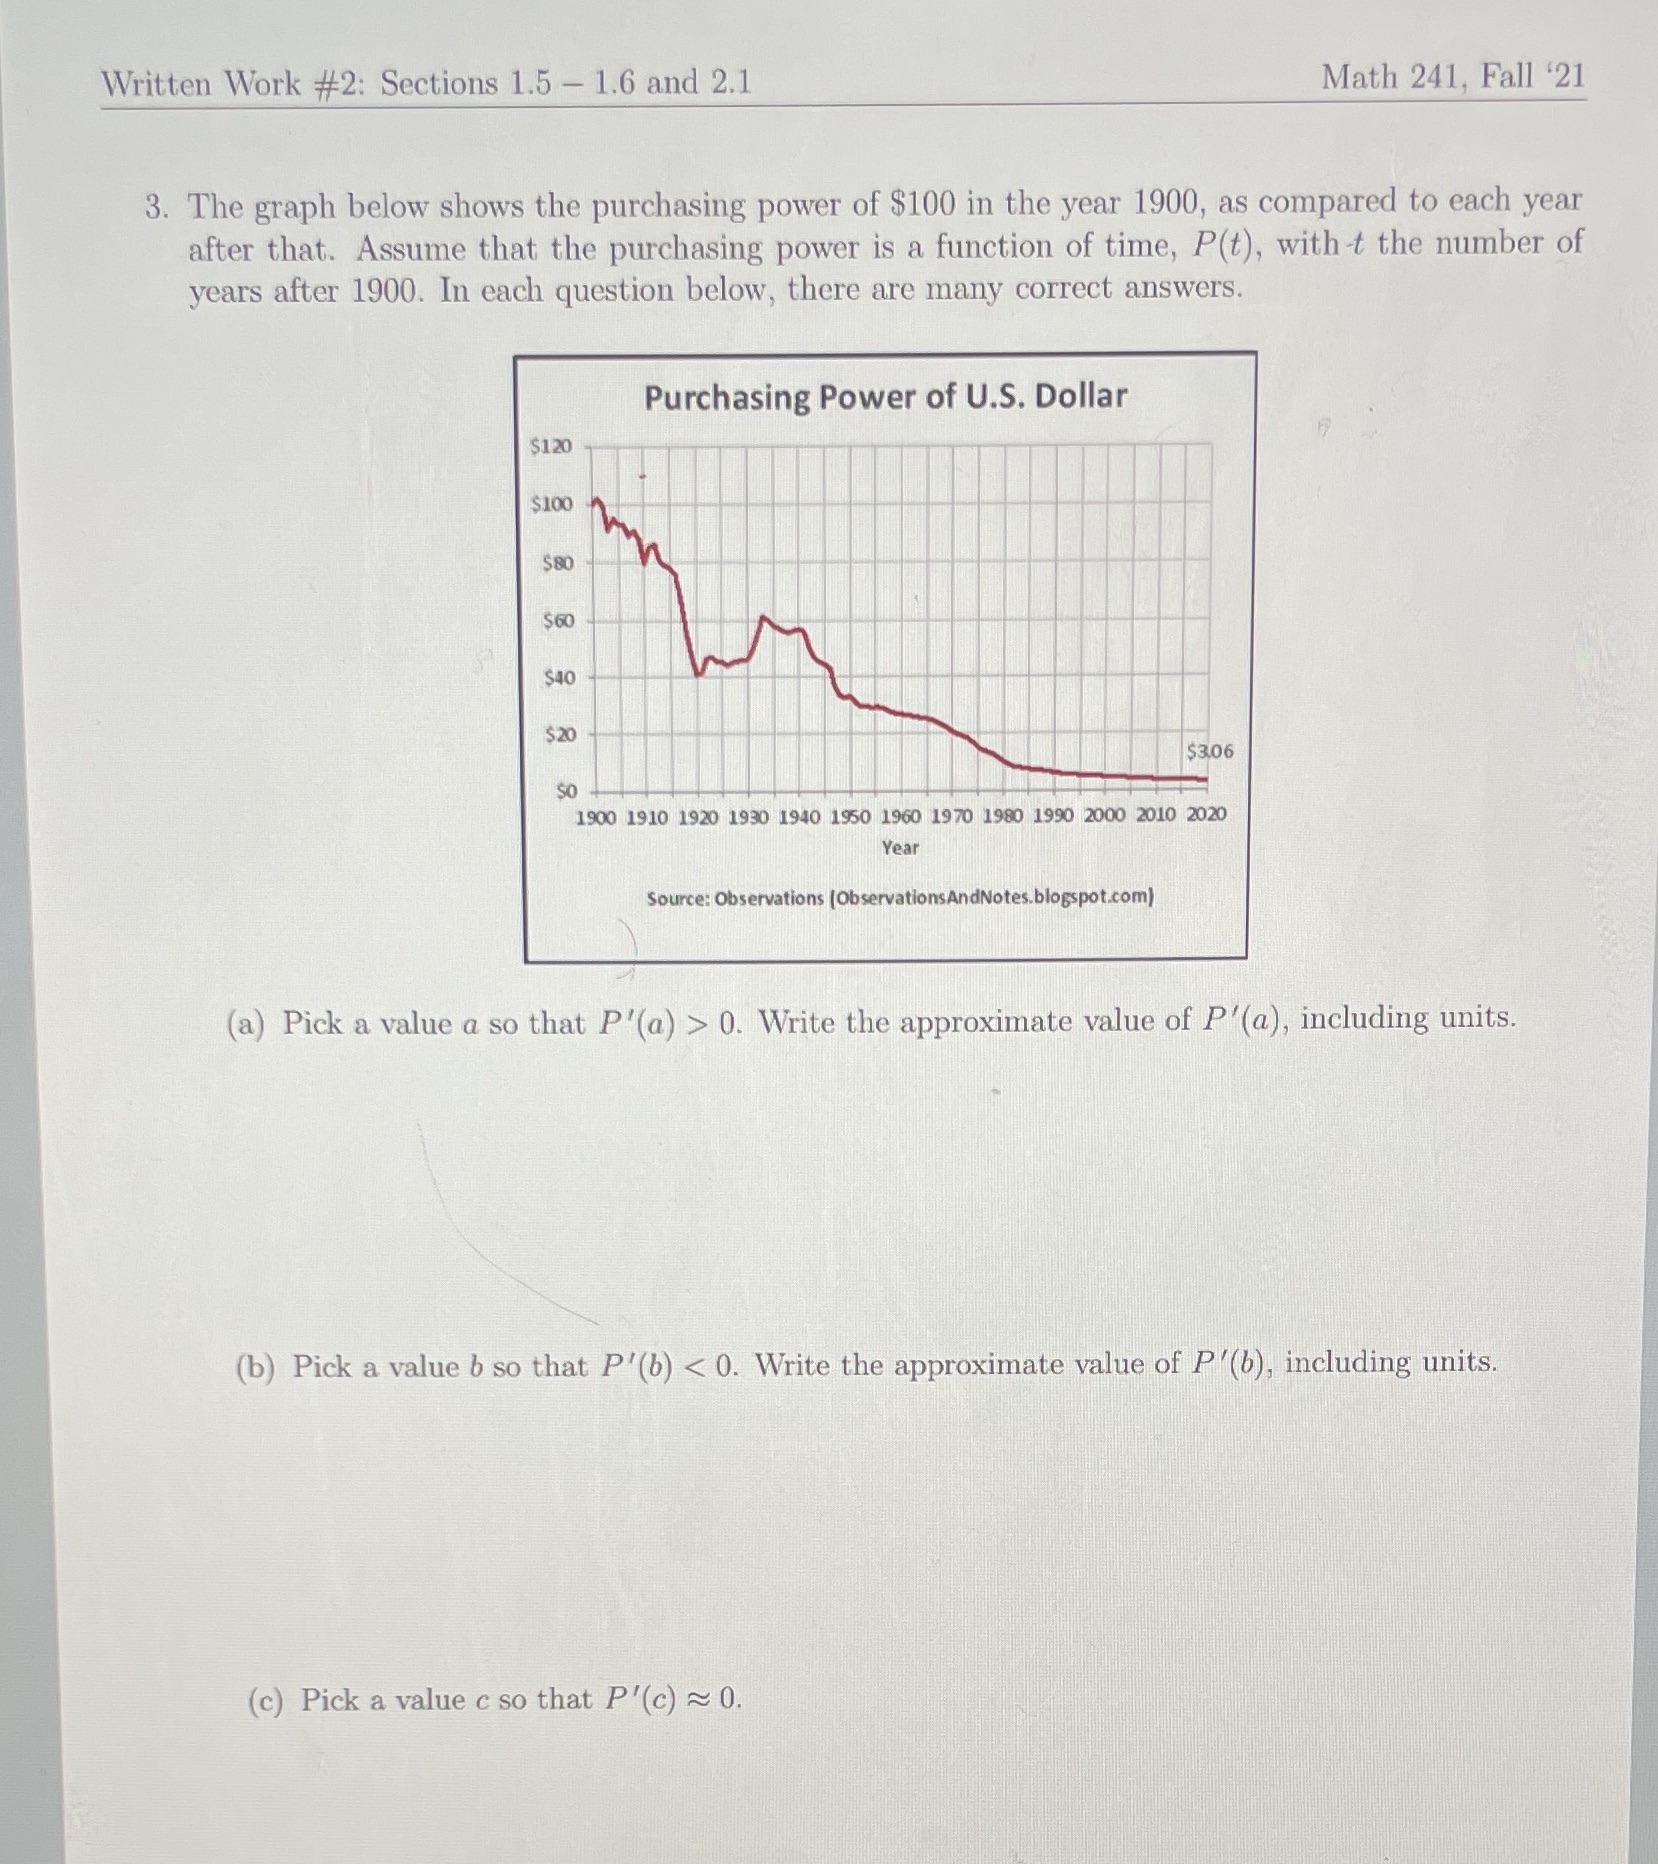
Written Work #2: Sections 1.5 - 1.6 and 2.1 Math 241, Fall '21 3. The graph below shows the purchasing power of $100 in the year 1900, as compared to each year after that. Assume that the purchasing power is a function of time, P(t), with t the number of years after 1900. In each question below, there are many correct answers. Purchasing Power of U.S. Dollar $120 $100 $80 $60 $40 $ 20 $306 SO 1900 1910 1920 1930 1940 1950 1960 1970 1980 1990 2000 2010 2020 Year Source: Observations [ObservationsAndNotes.blogspot.com) (a) Pick a value a so that P'(a) > 0. Write the approximate value of P'(a), including units. (b) Pick a value b so that P'(b)
Step by Step Solution
There are 3 Steps involved in it
1 Expert Approved Answer
Step: 1 Unlock

Question Has Been Solved by an Expert!
Get step-by-step solutions from verified subject matter experts
Step: 2 Unlock
Step: 3 Unlock